01
The information sits across separate sources
The share price on a financial portal, the accounts in the annual report, the ratios somewhere else and your positions at the broker. Pulling it into a spreadsheet is an unavoidable first step.
Financial statements, ratios, charts, watchlists and your portfolio for every company, in the same app. So your time goes into analysis rather than collection.
Free to sign up · 14-day trial when you activate · Cancel anytime
The share price on a financial portal, the accounts in the annual report, the ratios somewhere else and your positions at the broker. Pulling it into a spreadsheet is an unavoidable first step.
A P/E of 30 means nothing on its own: it depends on the company's growth, its margins and its peers. Every missing piece of context opens another search.
You buy without having reviewed the whole business, or you postpone the analysis and the idea is left unresolved.
STOK Terminal handles gathering and organizing the information. The analysis and the decision remain yours.
Three parts of the same process: understand the business, track its progress and see how it fits in your portfolio.
Review revenue, margins, cash, debt and ratios from the same company page, with comparable annual and quarterly periods.
Organize the companies you research and move from the quote to the business detail without rebuilding your process.
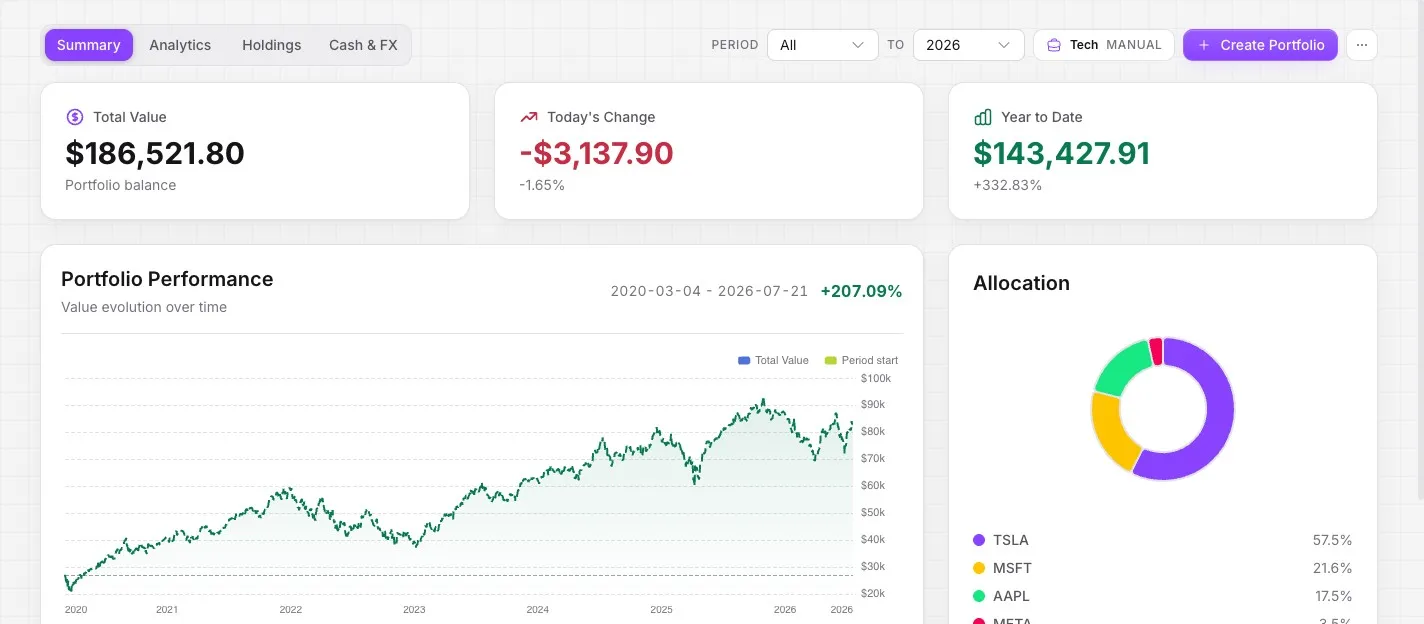
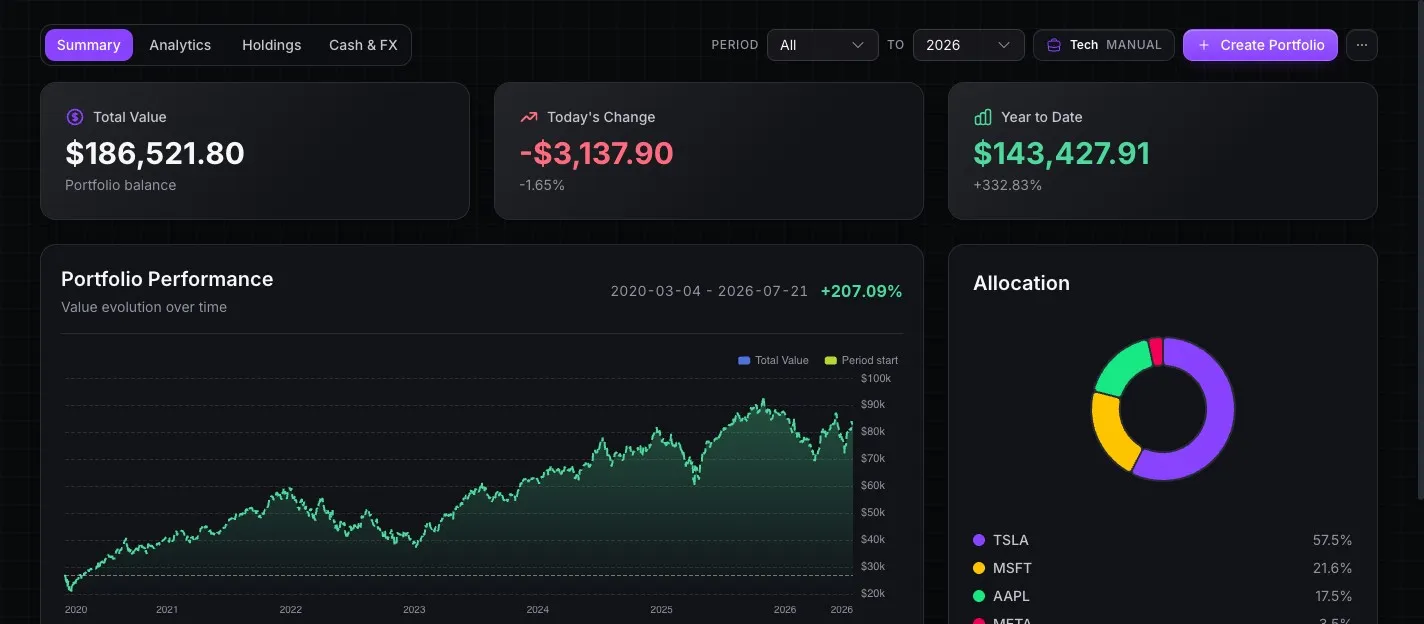
Record real or simulated positions and connect each company thesis to its weight, cost and performance.
Real screens captured in STOK Terminal.
Your whole process in one place: from the first market scan to each company's accounts and your portfolio. No ads or spreadsheets to rebuild every quarter.
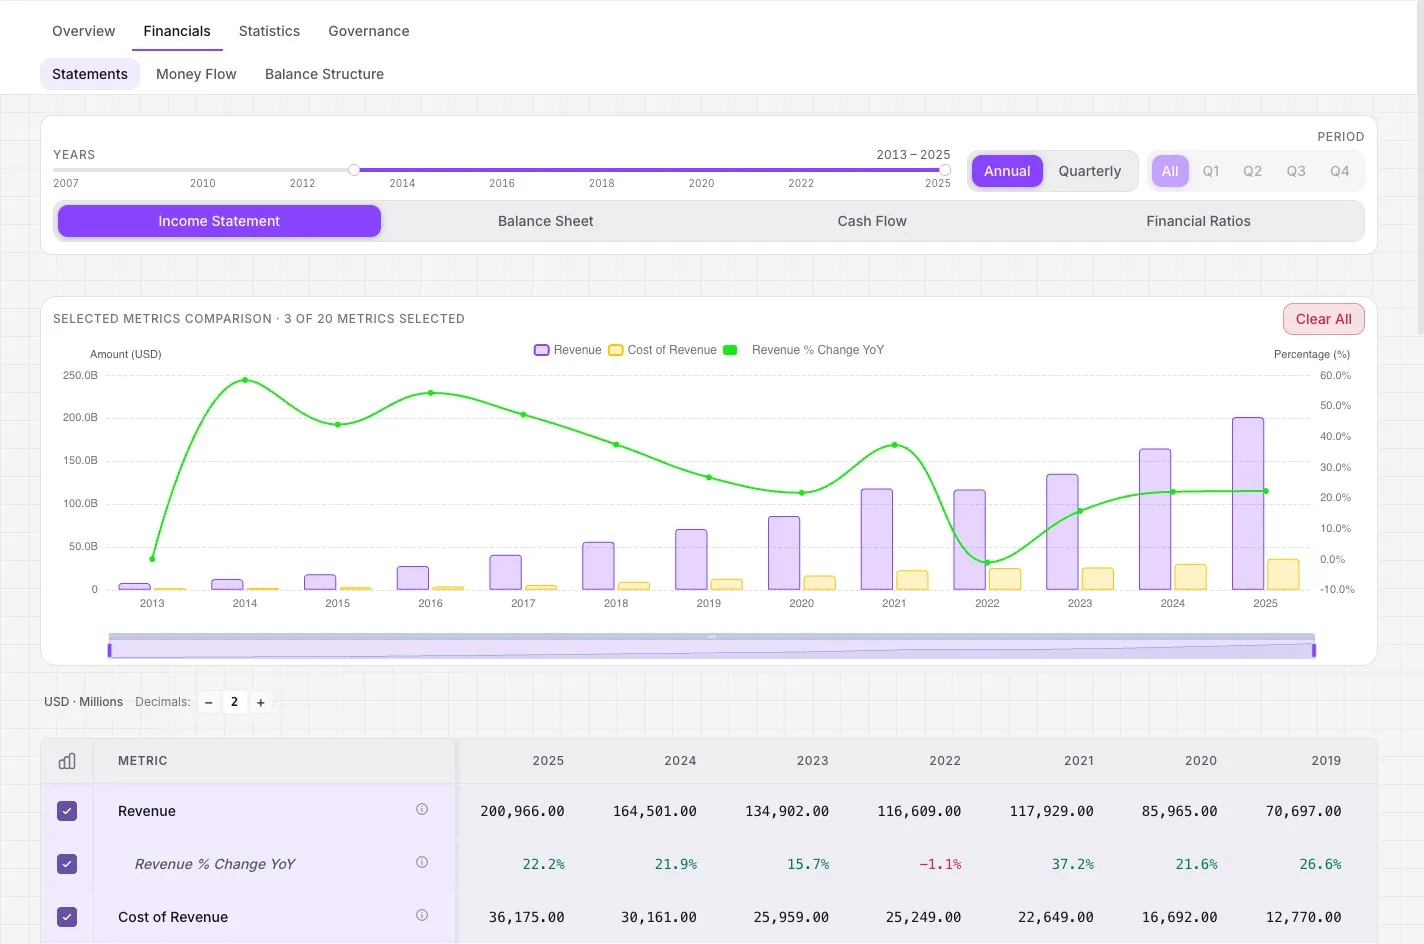
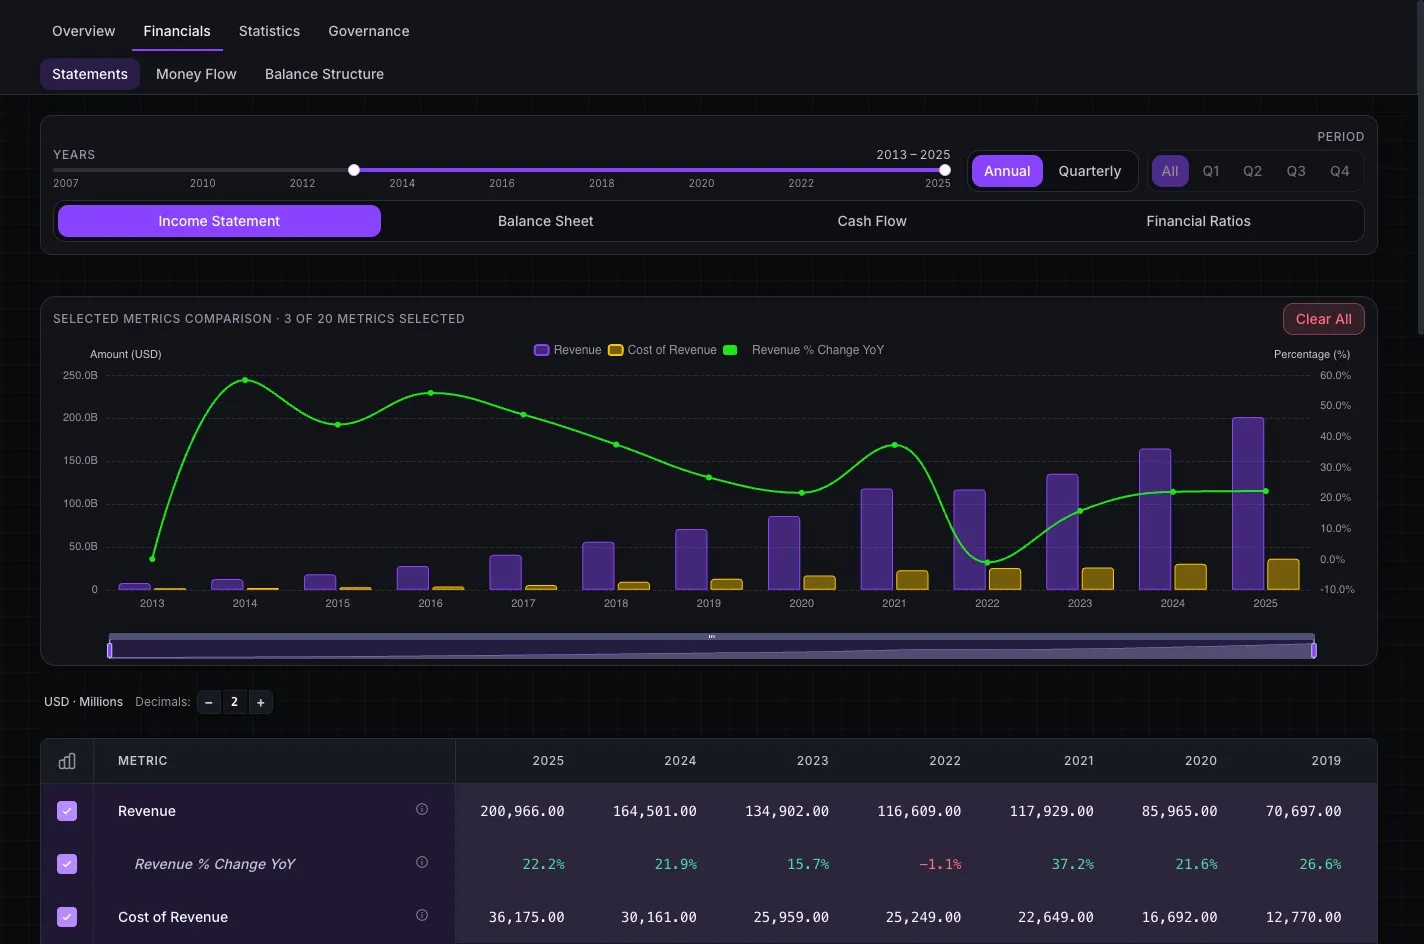
Income statement, balance sheet, cash flow, ratios and financial charts — annual and quarterly. Premium shows the maximum available history, with over 40 years for some companies.
Follow how earnings turn into cash and analyze P/E, ROE, ROIC, EPS, free cash flow, margins and their historical trend.
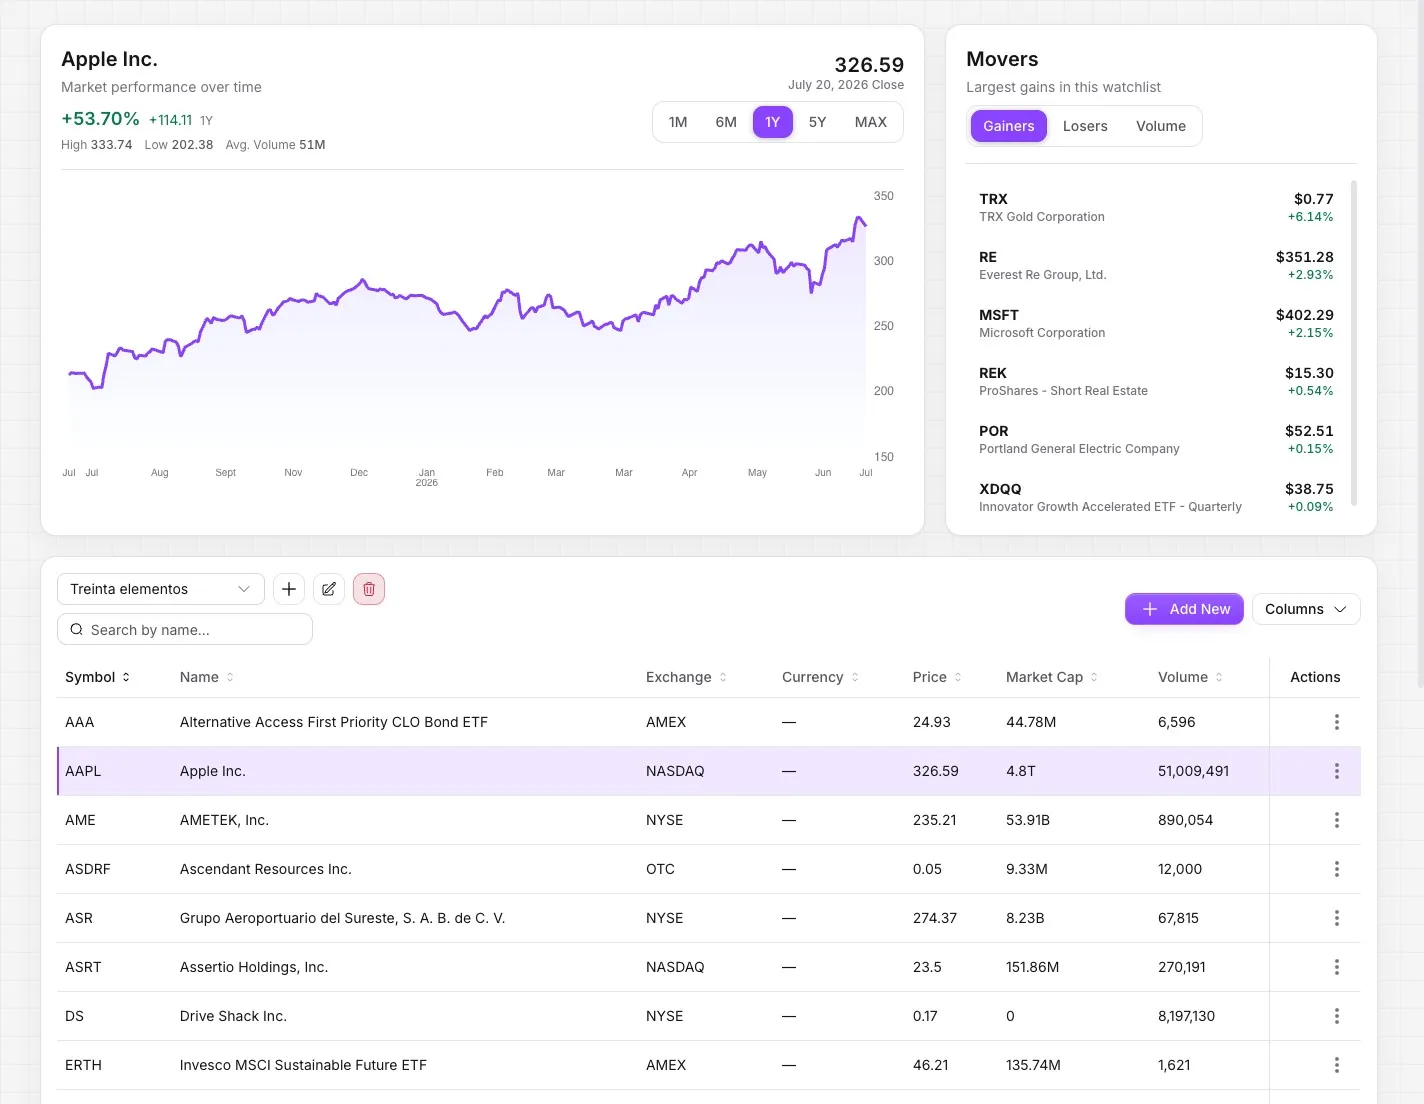
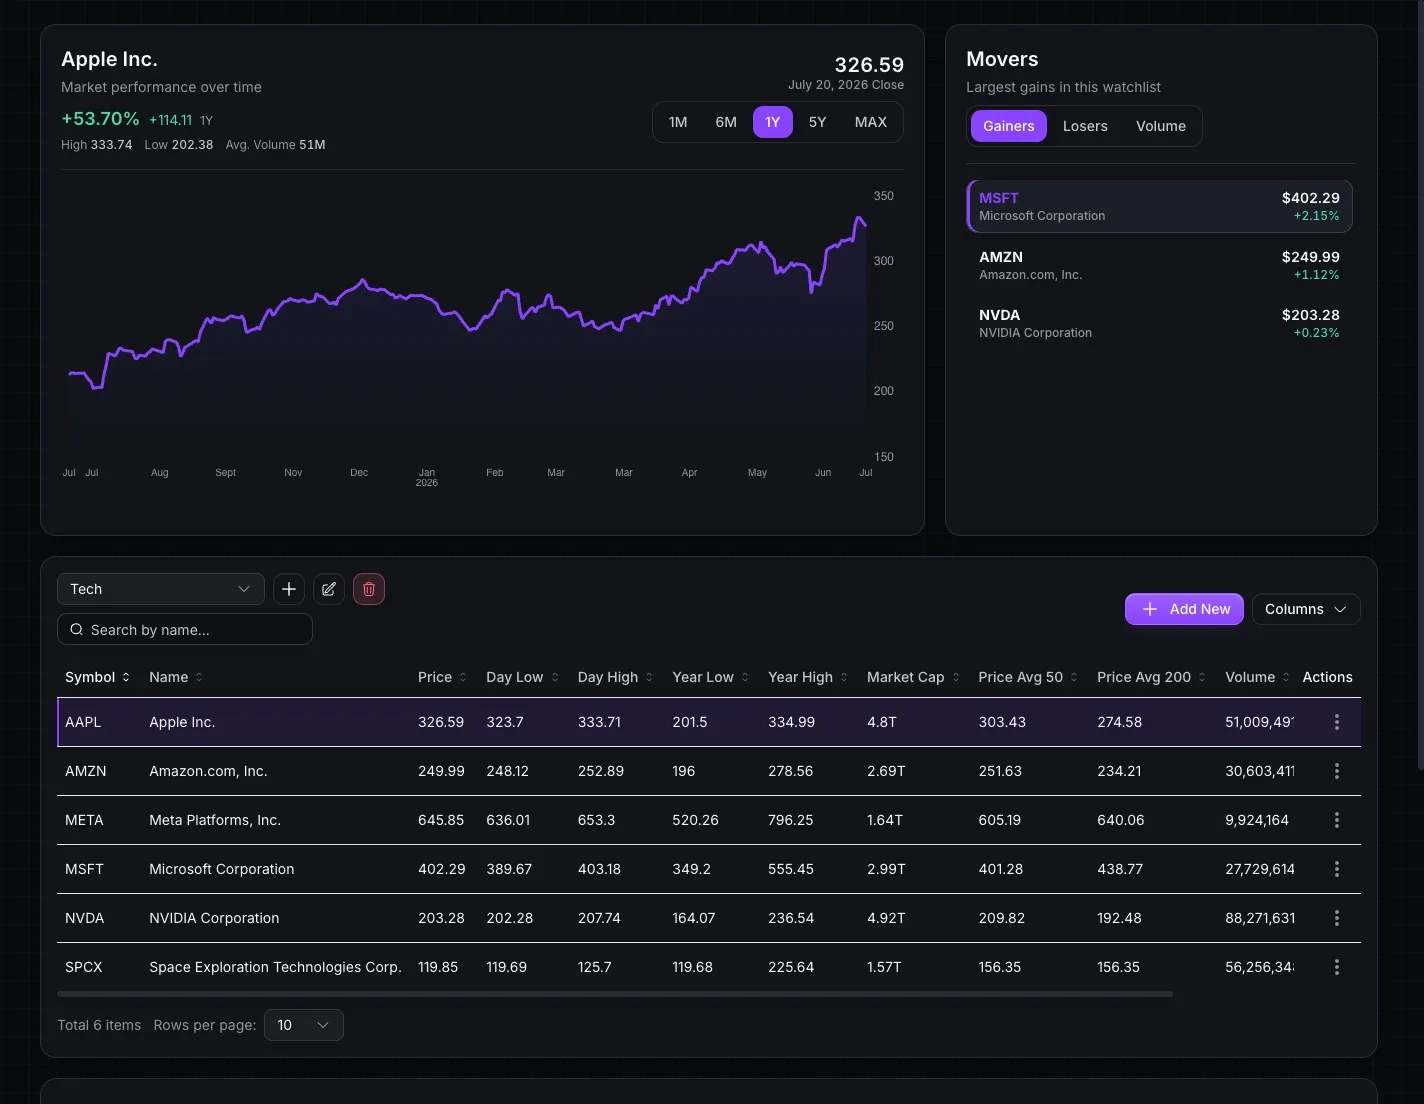
Multiple lists with quotes, price history, customizable columns and direct access to company pages.
Record your positions and review cash, performance and transactions in each currency.
A full transaction ledger with realized and unrealized P&L, plus a dashboard that breaks down cost, value and allocation per position.
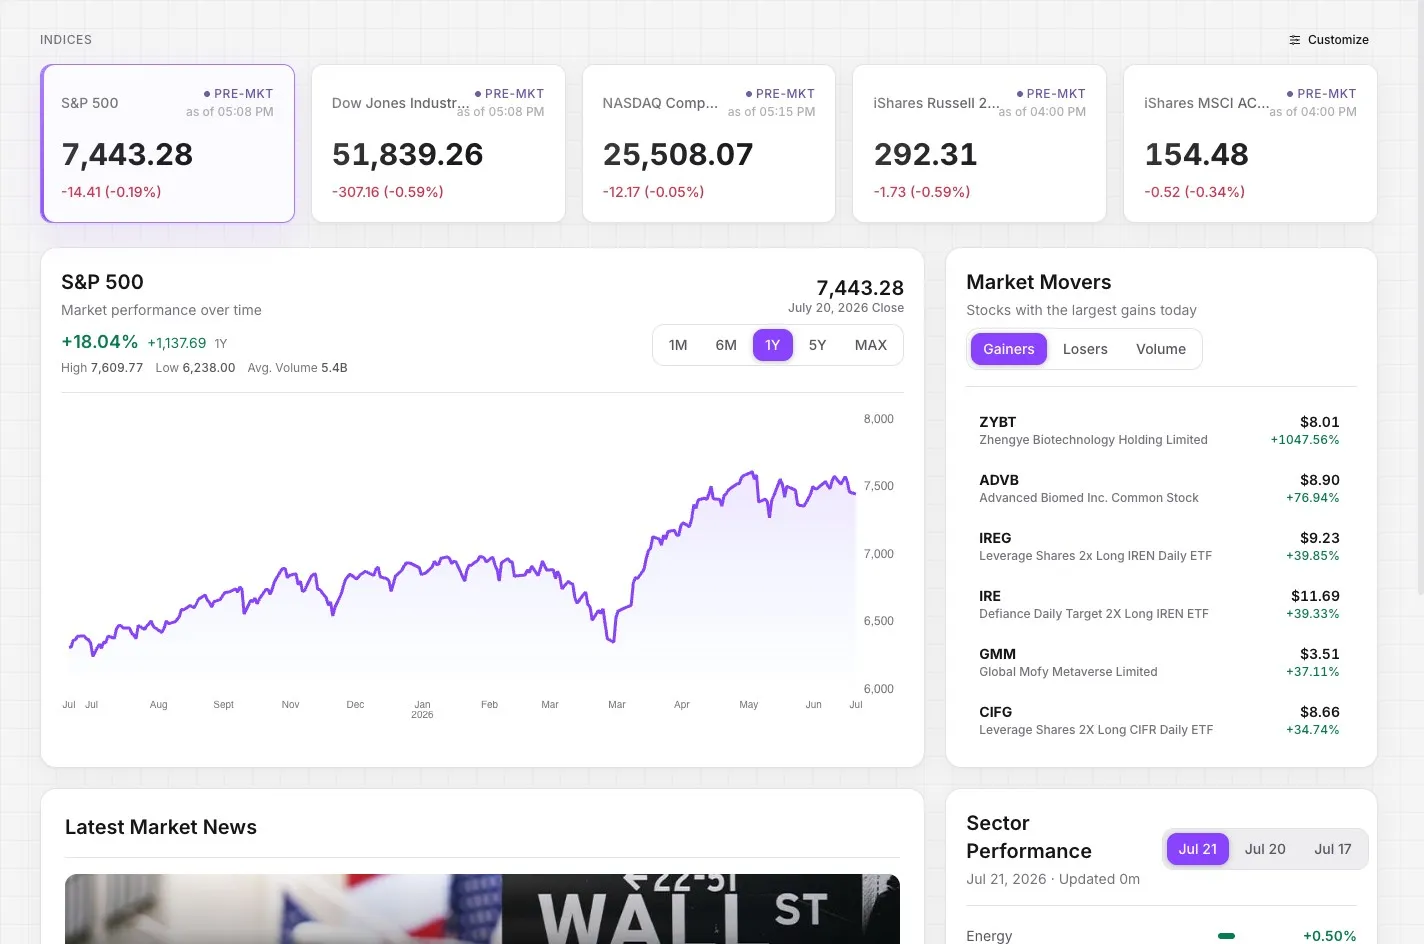
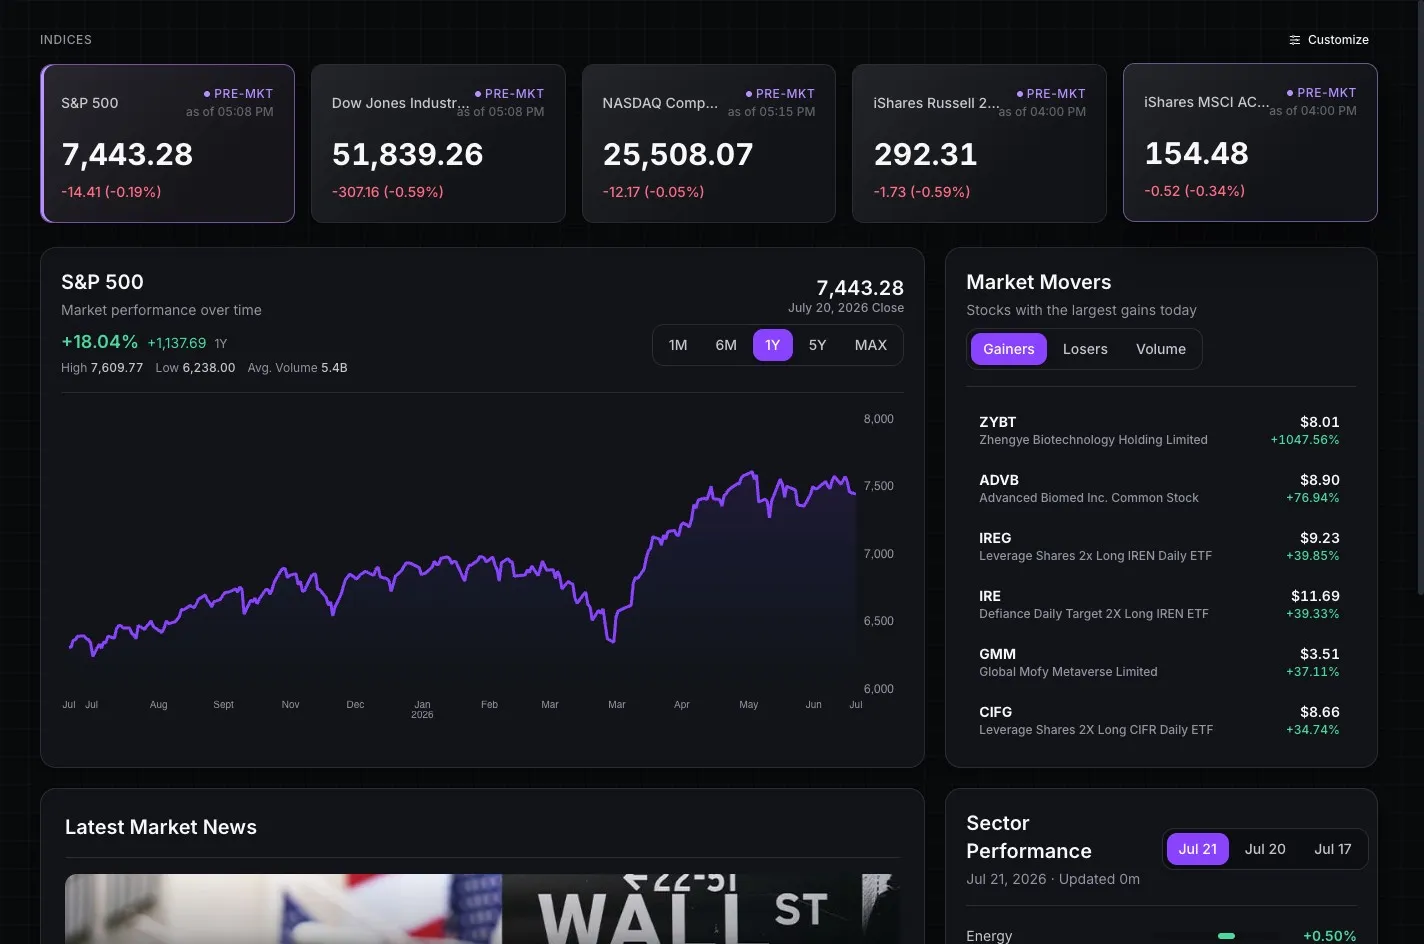
Customizable indices, top and bottom movers and standout sectors as a starting point before opening a company.
Access each company's 10-K and annual reports without leaving the application.
Save your thesis, links and notes on each company's page, with their history.
Line charts to read the trend at a glance and candlestick charts when you want to dig into technical analysis in more detail.
STOK Terminal is a research environment for investors who want to understand businesses before deciding. It brings together company data, watchlists and portfolio context, and turns none of it into recommendations or trading signals.
Financial statements, ratios, charts and company context are organized around the way investors review a business.
STOK Terminal provides information and workflow. Investment decisions, assumptions and conclusions remain with the user.
We prioritize reliable data and a stable product over adding new features every week.
Leave your email. When we launch, in a few weeks, you will receive your invitation: you activate 14 days free and, if you decide to continue, keep 50% off the public price while you stay subscribed. No card and no charge today.
Leave your email and let us know what you currently use. We'll reserve your place and include you in the first invitations.
STOK Terminal helps you understand the business behind a ticker without juggling several separate tools. It's a stock-research web app for independent retail investors that brings company fundamentals, financial statements, ratios, charts, documents, watchlists and portfolio tracking in the same app.
It is built for independent retail investors who research individual companies before investing — investors who review fundamentals, compare companies and keep their own watchlists and portfolio. It is not designed for quick quote lookups, generic market headlines, trading signals or day-trading.
Leaving your email is free. When you activate your access, you start with a 14-day free trial (no charge today). After that you always pay half the public price: the 50% discount is yours for as long as your subscription stays active, with no expiry. The discount applies to the then-current public price. Cancel anytime.
Signing up is free and creates no charge. We launch in the coming weeks and open access in signup order, so there may be a short wait. The trial only starts when you accept your invitation; nothing is charged until the 14 days are up, and we remind you beforehand.
STOK Terminal is built around the recurring work of following companies, not one-off quote lookups. Instead of spreading fundamentals, documents, watchlists and portfolio across separate tools, it keeps them in one place so you can review what changed each quarter without rebuilding spreadsheets.
No. STOK Terminal is an informational research tool. It does not provide financial advice, recommendations or trading signals — every investment decision stays with you.
We launch in the coming weeks. Leave your email on the home page: your spot is saved in signup order and you secure 50% off. When your turn comes, you'll receive your invitation by email to activate the 14-day trial.
STOK Terminal is a web-based stock research terminal for independent retail investors. It brings company fundamentals, financial statements, ratios, filings, charts, watchlists and portfolio tracking into one workflow. It is not a broker, does not execute trades, and does not provide trading signals or investment advice.
Join free: a 14-day trial when you get in, 50% off while you stay subscribed, cancel anytime.