Let’s start with the obvious: this article is written by one of the two sides. We are the STOK Terminal team, and if you are looking for a 100% neutral comparison, it doesn’t exist — not here, and not in the affiliate reviews that monetize every click to Simply Wall St. What we can offer is an honest comparison: we will openly tell you what Simply Wall St does better than us, and exactly which type of investor we are the wrong choice for.
The Core Difference: Verdict vs Workbench
Everything else flows from one opposite design decision:
Simply Wall St gives you the conclusion. Its famous “snowflake” chart summarizes a company’s health across five axes at a glance, and its automated model computes a “fair value” that tells you whether the stock looks under- or overvalued. You consume a pre-made analysis.
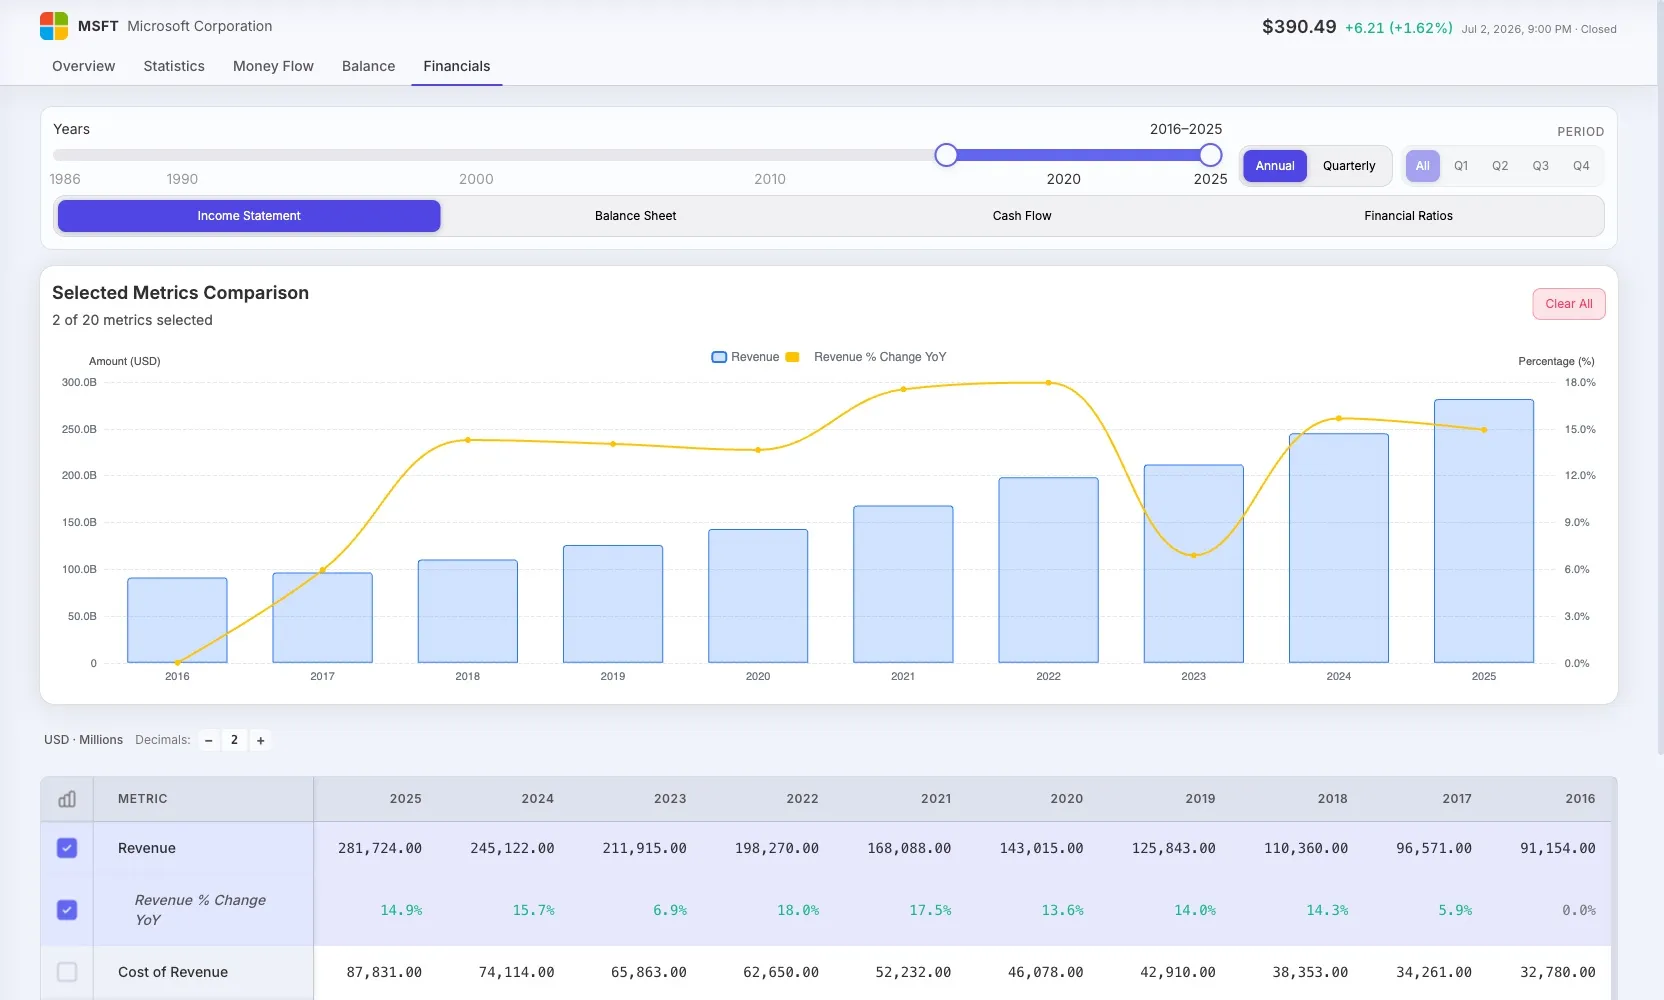
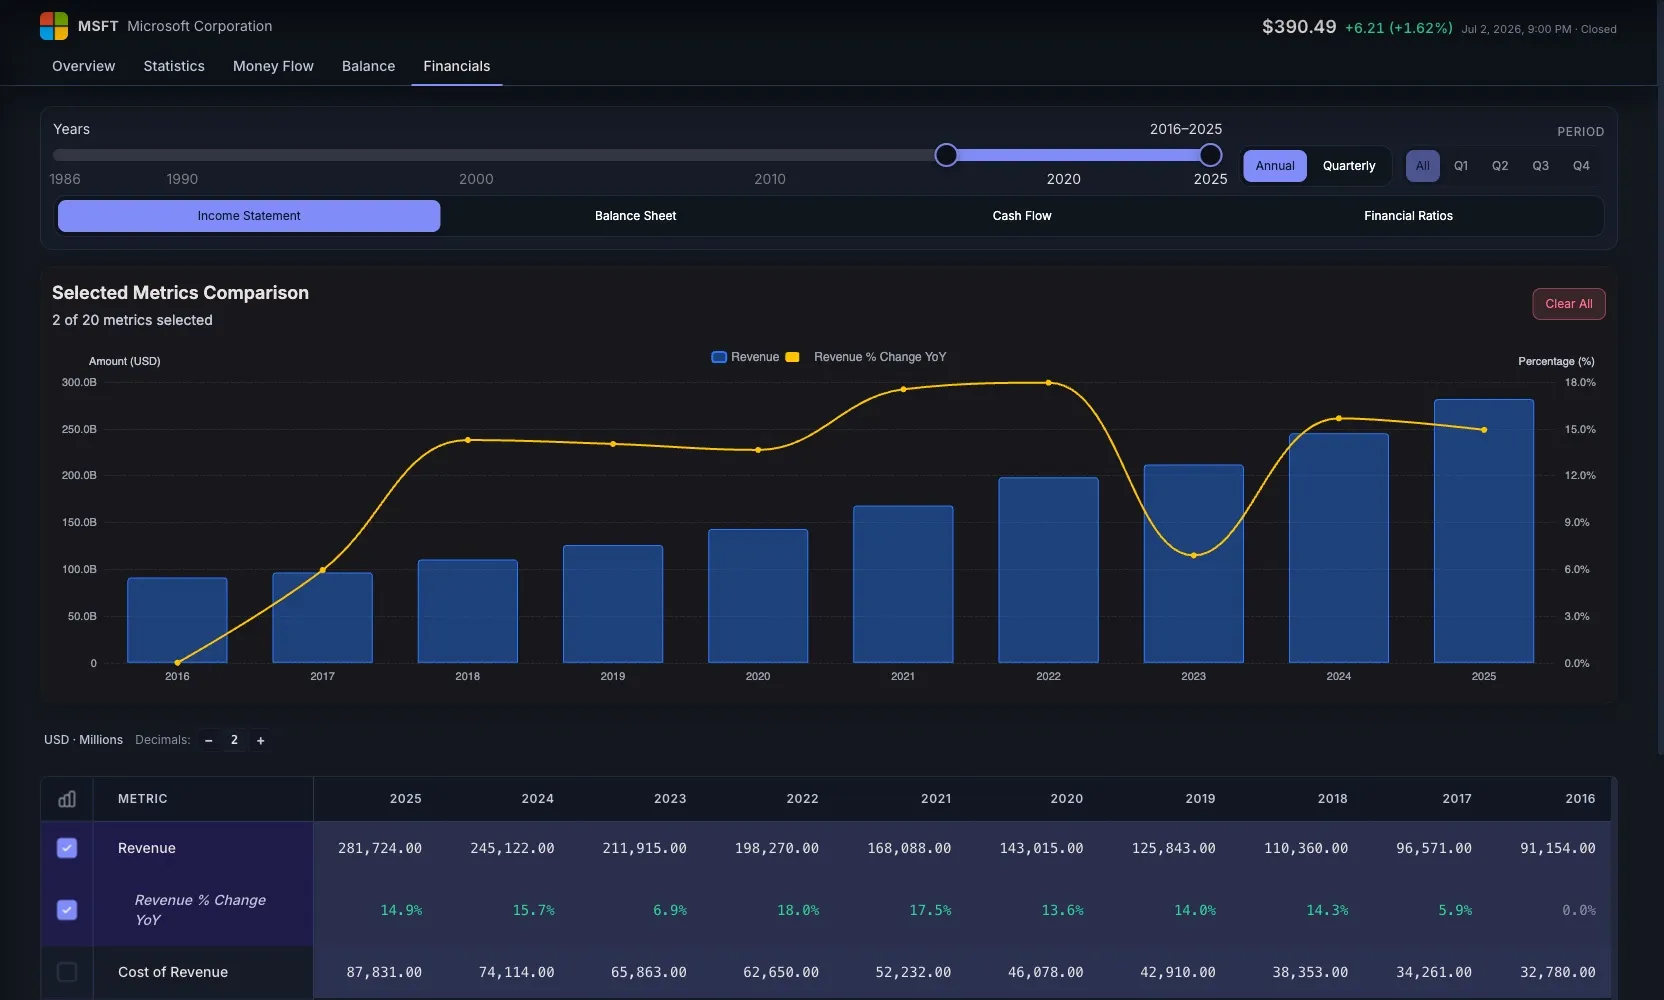
STOK Terminal gives you the data so the conclusion is yours. Income statement, balance sheet, cash flow and multi-year ratios in comparable tables, connected to your watchlists and your portfolio. You build the thesis — we remove the work of collecting and organizing, not the thinking.
Neither philosophy is “better”: they serve different investors. And that is the key to this whole comparison.
What Simply Wall St Does Better (No Hedging)
- The most accessible visualization on the market. The snowflake is probably the best piece of information design in retail investing. For grasping a company’s snapshot in 10 seconds, nobody matches it.
- Product maturity. Years in the market, millions of registered users, polished mobile apps and a well-worn product. STOK Terminal is in early access; they have been iterating for a decade.
- Broad global coverage, including small markets.
- Automated fair value for thousands of companies — with the caveats below, useful as a first filter.
- Built-in screeners (3 on Premium, 10 on Unlimited). STOK Terminal has no screener today.
- Multi-language interface and an established user community.
If after reading this list you think “that’s exactly what I want”, the honest answer is: choose Simply Wall St.
What STOK Terminal Does Differently
STOK Terminal is currently in early access, opened from a free list in signup order. Joining the list is free and creates no charge; we say so upfront. Early users pay €6.95/month once they activate their access — a 50% discount off the €13.90 public price — and keep that 50% discount on the future public price while their subscription remains active. If they cancel and return later, the then-current price will apply. Nothing is charged while you wait on the list, and the trial only starts when you accept your invitation.
- Raw, multi-year fundamentals, side by side. Where Simply Wall St compresses into five axes, we show you the full series: years of margins, cash, debt and returns in tables you can read, compare and question. It is the difference between being told “financial health: 4/6” and seeing for yourself that the margin has been compressing for three years.
- The complete flow in one place: research the company → follow it in watchlists with quotes and news → connect it to your portfolio. The question “how are the businesses I own evolving?” has its own screen.
- No automated verdicts. We don’t hand you a fair value computed by an opaque model. We give you the numbers and the guides to interpret them — from ROIC to free cash flow. For someone who wants to learn to analyze, we believe it is the better path; for someone who wants a quick answer, it is more work.
- Euro pricing: €6.95/month at the launch price (50% off the €13.90/month public price), with guides in English and Spanish.
What we don’t have today, stated plainly: a snowflake or equivalent visual summary, a screener (coming later), automated fair value, native mobile apps (the web app works well on mobile), or Simply Wall St’s years of maturity. We are in early access via waitlist, building the core flow first.
The Caution About Automated “Fair Value”
It deserves its own section because it is Simply Wall St’s star feature and also its biggest usage risk. An automated fair value is the output of a discounted cash flow model with standardized assumptions (growth, discount rate) that you neither choose nor fully see. Two practical problems:
- False precision. “Undervalued by 23%” sounds scientific, but move two of the model’s assumptions and the number changes completely. Valuation is a judgment-built range, not a traffic light.
- It invites skipping the work. If the verdict is already given, why read the annual report? And precisely in the companies where the standard model fails (cyclicals, businesses in transformation, one-off-heavy years) is where not reading it costs the most.
This is not a flaw unique to Simply Wall St — it is inherent to any automated valuation. But if you use their fair value, use it as an initial hypothesis, never as a conclusion.
Comparison Table (July 2026)
| Simply Wall St | STOK Terminal | |
|---|---|---|
| Philosophy | Pre-built visual verdict | Raw data for your own analysis |
| Visual summary (snowflake) | Yes — its strength | No |
| Automated fair value | Yes | No (by design) |
| Multi-year fundamentals in tables | Limited | Yes — the core of the product |
| Watchlists connected to company pages | Basic | Yes, with quotes and news |
| Portfolio | 1–5 depending on plan, limited holdings on lower tiers | Yes, integrated |
| Screener | Yes (3–10 by plan) | No (later) |
| Language | Multi-language | English + Spanish (site and guides) |
| Billing | USD (~$10.95 Premium / ~$21.50 Unlimited per month; less on annual) | EUR (€6.95/month for early users; €13.90 public) |
| Product maturity | Mature, years in market | Early access |
Simply Wall St plan limits checked today on its plans page: Free 5 reports/month, 1 portfolio of 10 holdings; Premium 30 reports/month, 3 portfolios; Unlimited unlimited reports, 5 portfolios.
When to Choose Each
Choose Simply Wall St if:
- You want a fast, visual snapshot of any company without opening a financial statement.
- You prefer consuming a pre-built analysis to constructing your own.
- You value mature mobile apps and small-market coverage.
Choose STOK Terminal if:
- You want to do your own analysis with the data in front of you — and learn the method along the way.
- You care about the full flow: analysis → watchlist → portfolio in one place.
- You prefer paying in euros.
- You accept an early-access product in exchange for the launch price.
Use both if: you want Simply Wall St’s visual radar to discover and discard, and STOK’s workbench to go deep on whatever passes the filter. They don’t compete at the same step of the process.
Frequently Asked Questions
What is the main difference between STOK Terminal and Simply Wall St? Philosophy. Simply Wall St hands you a pre-built visual verdict (the “snowflake” chart and an automated fair value); STOK Terminal gives you raw multi-year fundamentals connected to your watchlists and portfolio, so you build your own analysis. One summarizes for you; the other gives you the workbench.
Which one is cheaper? They are comparable. Simply Wall St: Premium ~$10.95/month and Unlimited ~$21.50/month (less on annual billing), in dollars. STOK Terminal: €6.95/month at the launch price on activating access (€13.90/month public price), in euros. Verify current prices on both websites — they change with promotions.
Is Simply Wall St reliable for making decisions? Its data is solid and its visualization excellent. The caution is the automated “fair value”: it is the output of a model with assumptions you do not control. Use it as a starting point, not a verdict — and always cross-check against the financial statements.
Can I use both? Yes, and it makes sense: Simply Wall St as a visual radar to discover and discard quickly, and a data tool like STOK Terminal for the deep analysis of whatever passes the filter. Many investors combine a visual summary with a data workbench.
Do You Want the Verdict, or the Data?
If it’s the latter, we are building STOK Terminal for you: multi-year fundamentals, watchlists and portfolio in one flow.
👉 Join STOK Terminal free — 14 days free on activating your access, 50% discount for as long as your subscription stays active.
Transparency
Comparison written by the STOK Terminal team — keep that in mind as you read. Simply Wall St plan limits were checked on its official website on July 4, 2026, and prices were cross-checked against public sources the same day; they can change with promotions or by region, and we don’t know how they will evolve. Confirm current numbers at simplywall.st before subscribing. This article is informational and not financial advice.