
Morningstar built its reputation on independent research, and that reputation is well earned. The star ratings, the Economic Moat framework and the analyst reports have made it the name in stock and fund research for decades.
But if you are reading this, something is not working. Maybe Morningstar Investor at $34.95/month feels expensive for the data you actually use, or you want a tool built for your own bottom-up analysis instead of someone else’s verdict.
This article is published by the Stok Terminal team. We put our own app first because it is the one we know best, and we compare it with the options a Morningstar user would realistically consider. Competitor prices carry the date they were checked on each vendor’s site.
Quick answer: if you mainly look at financials and want to reach your own conclusions, Stok Terminal puts fundamentals, ratios, earnings and your portfolio in one place, with Plus at €13.90/month$13.90 USD/month against $34.95 for Morningstar Investor. If you read the analyst reports and Moat ratings, stay on Morningstar. For free long U.S. history and screening, Macrotrends and Finviz. For a portfolio of funds and ETFs, Portfolio Visualizer and justETF.
Morningstar alternatives — comparison table (updated October 2026)
| Tool | Best for | Fundamental history | Analyst reports and Moat | Portfolio | Monthly price |
|---|---|---|---|---|---|
| Stok Terminal | Your own research, with your portfolio beside it | 7 / 15 / more than 40 years for some companies | No (by design) | Yes, multi-currency | From €9.90/month$9.90 USD/month · plans |
| Morningstar Investor | Analyst research and fund analysis | Behind the paywall | Yes | Portfolio X-Ray | $34.95 |
| Yahoo Finance | A familiar generalist, depth on Gold | Short on free; about 40 years on Gold | Research reports (Silver, Gold) | Basic | Bronze $9.95 / Silver $24.95 / Gold $49.95 |
| Investing.com | Economic calendar and multi-asset quotes | Few years free | No | Basic | Free; InvestingPro rate not quoted |
| Seeking Alpha | Ratings and contributor articles | 5 years free; 10 on Premium | Quant, author and sell-side ratings; no Moat | Yes, with broker linking | Free account; Premium has no monthly plan |
| Finviz | Fast screening | 3 years free; 8 on Elite | No | Free portfolios | Free; Elite $39.50 |
| Macrotrends | Free long U.S. history | More than ten years, U.S. companies | No | No | Free |
| Portfolio Visualizer | Backtesting fund and ETF portfolios | No company statements | No | Backtests of up to 15 assets on free | Free; no monthly paid plan |
| justETF | Researching and comparing ETFs sold in Europe | No company statements | No | 1 portfolio on free | Free; Premium has no monthly plan |
| Simply Wall St | Visual summaries | Trailing-twelve-month figures, without full tables | No (automated analysis) | Yes | No monthly plan in Spain |
| Koyfin | Broad data and dashboards | 2 years on free; up to 10 on paid plans | No | Yes (1 on free) | Plus $49 |
Monthly billing rates checked on each vendor’s site: Koyfin and Simply Wall St on September 22, 2026; Yahoo Finance and Finviz on October 7, 2026; Morningstar on October 8, 2026; Seeking Alpha, Portfolio Visualizer and justETF on October 9, 2026. InvestingPro has no standard monthly rate we could verify, Seeking Alpha Premium has no monthly plan, and Portfolio Visualizer and justETF have no monthly paid plan, so none of them is quoted. Stok Terminal shows its standard monthly price.
Launch offer
During launch, choose Starter at €8.90/month$8.90 USD/month instead of €9.90/month$9.90 USD/month, Plus at €9.73/month$9.73 USD/month instead of €13.90/month$13.90 USD/month and Premium at €17.94/month$17.94 USD/month instead of €29.90/month$29.90 USD/month, or up to 50% off on annual billing. Your tariff keeps the same amount while your subscription remains active. Upgrades and monthly-to-annual switches keep the launch tariff; downgrades and annual-to-monthly switches use the current standard tariff. Cancelling ends it. Create your account with email and terms acceptance, verify the code, then choose a plan and provide your card to start the 14-day trial. See the plans.
Where Morningstar frustrates hands-on investors
The frustration starts when Morningstar is used as a do-it-yourself stock analysis tool, where you dig into the financials and form your own conclusions.
- Most of the useful data sits behind the paywall: analyst reports, fair values and detailed historical financials.
- The interface is built around reading a conclusion, so comparing companies on your own metrics over time takes more clicks than it should.
- Portfolio tracking without the fundamentals attached. You see what you own, but not easily which holdings are improving or deteriorating as businesses.
In short: Morningstar is excellent if you want someone else’s analysis, and frustrating if you want to do your own.
What to look for in a Morningstar alternative
If you are leaving Morningstar to research stocks yourself, these are the criteria that matter:
- History depth. At least ten years of annual and quarterly statements, so you can see a business through a full cycle.
- Key ratios ready to use. ROIC, free cash flow yield, margins and debt ratios already calculated. Our ROIC guide and free cash flow guide explain why these matter most.
- Multi-year trends. A ratio is more useful as a series over time than as today’s snapshot.
- No ads in the way. Long research sessions are easier on a paid tool without ads than on an ad-funded free site.
- Your portfolio connected to the fundamentals. Seeing how each holding is doing as a business, not only its price.
- A reasonable price. If you do not read the analyst reports, you should not pay for them.
If you mainly own mutual funds and ETFs, the criteria are different: fund costs, allocation and overlap. Stock research tools do not cover that, so look at the fund options below: Portfolio Visualizer and justETF.
The best Morningstar alternatives compared (2026)
1. Stok Terminal — your own research, with your portfolio beside it (our app)
Stok Terminal is built for the investor who wants to reach their own conclusions. What you can do in your first five minutes:
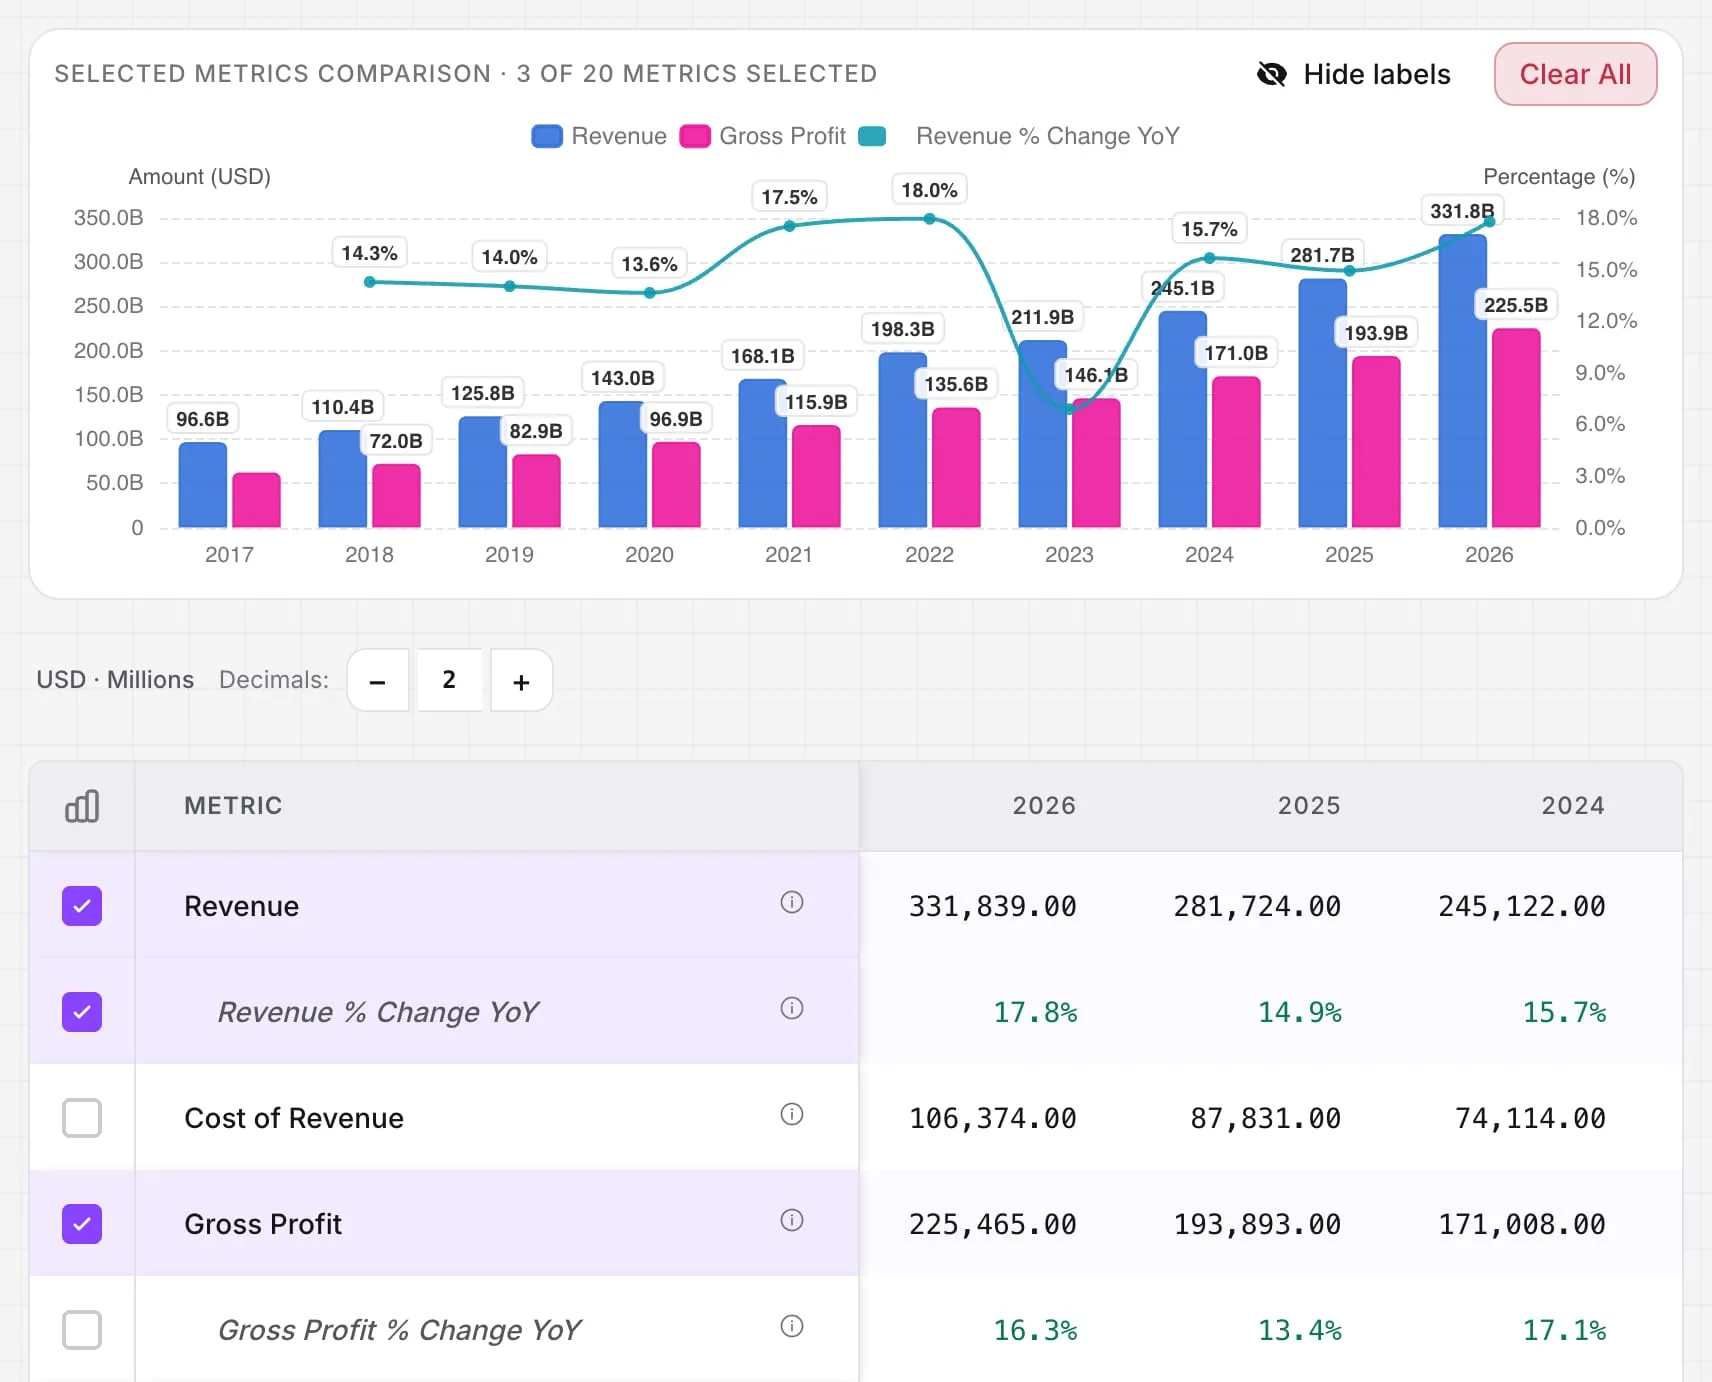
- Open a company and read its statements over 15 years (Plus) in one chart: revenue, margins and free cash flow, annual or quarterly, up to 20 metrics at once.
- Track ratios over time, from ROIC to valuation multiples, in a ratio explorer with annual, quarterly and daily series.
- Read what management said on the earnings call, in the full transcript, and check it against the quarter’s statements.
- Compare companies side by side (2 on Starter, 4 on Plus, 6 on Premium), then follow them in a watchlist or your portfolio.
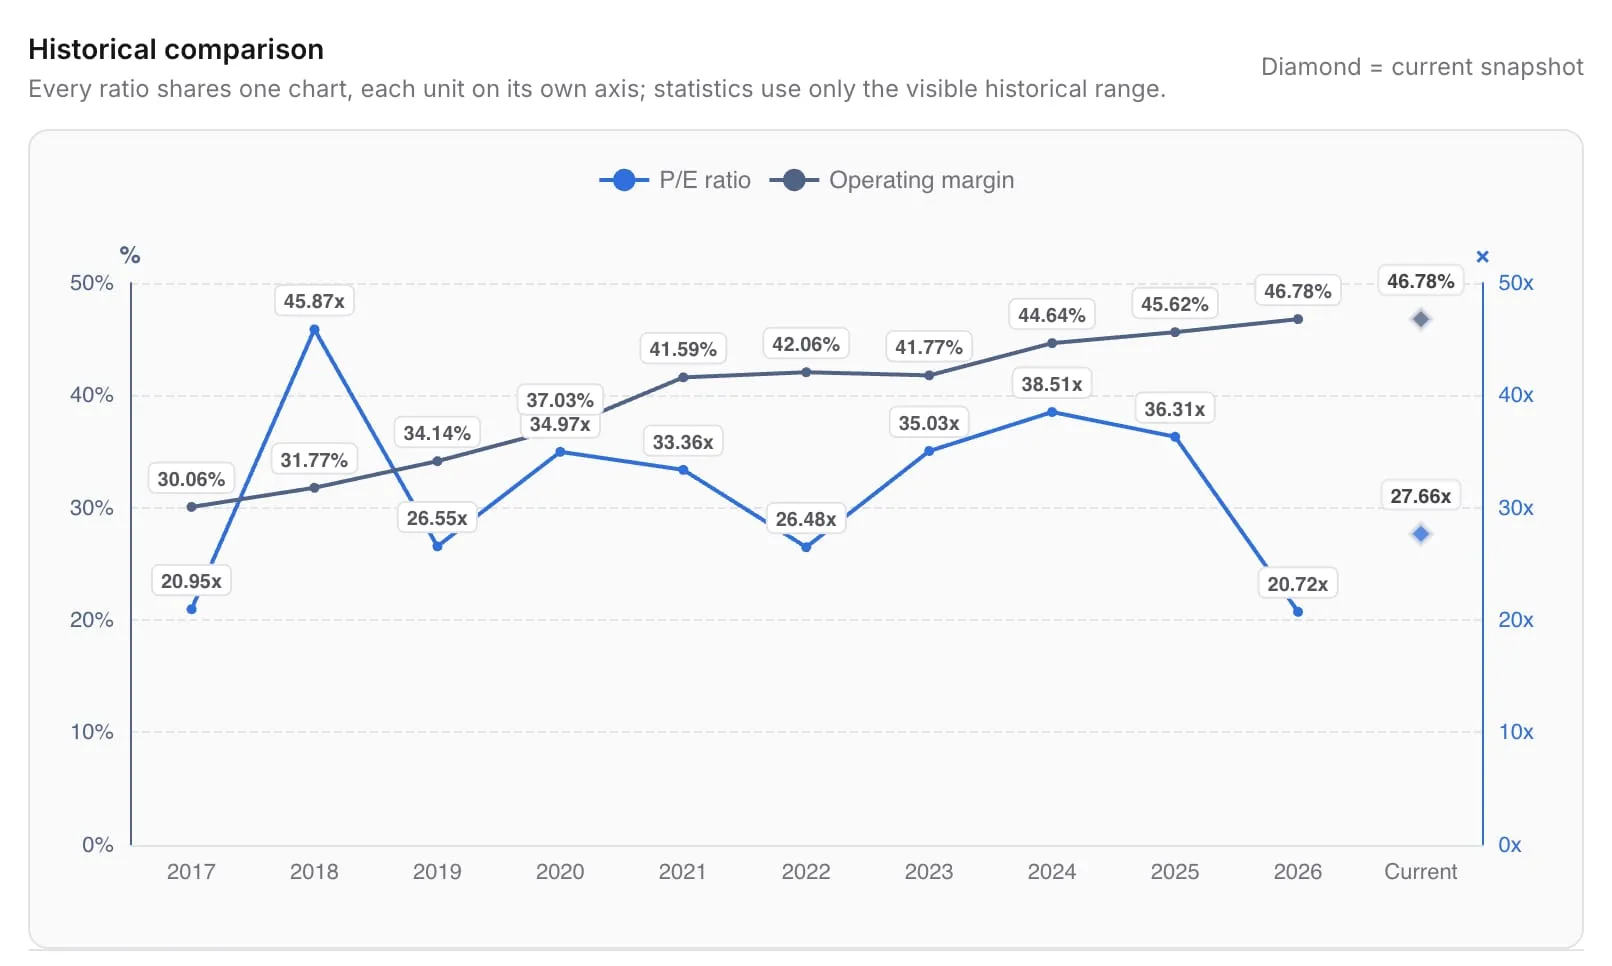
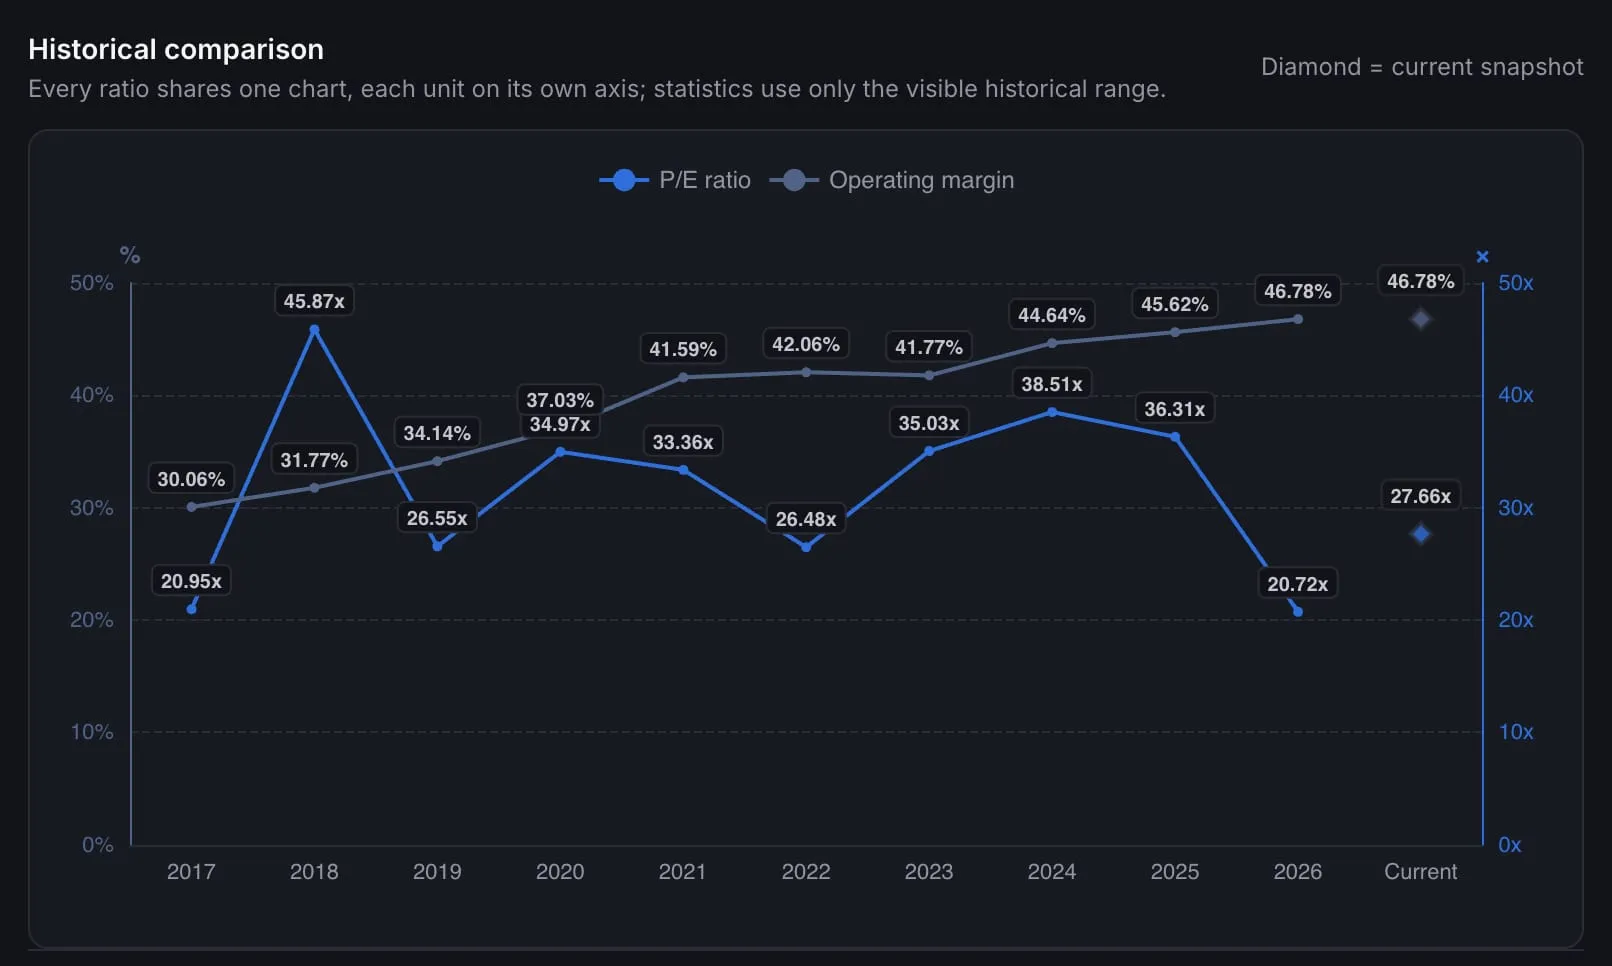
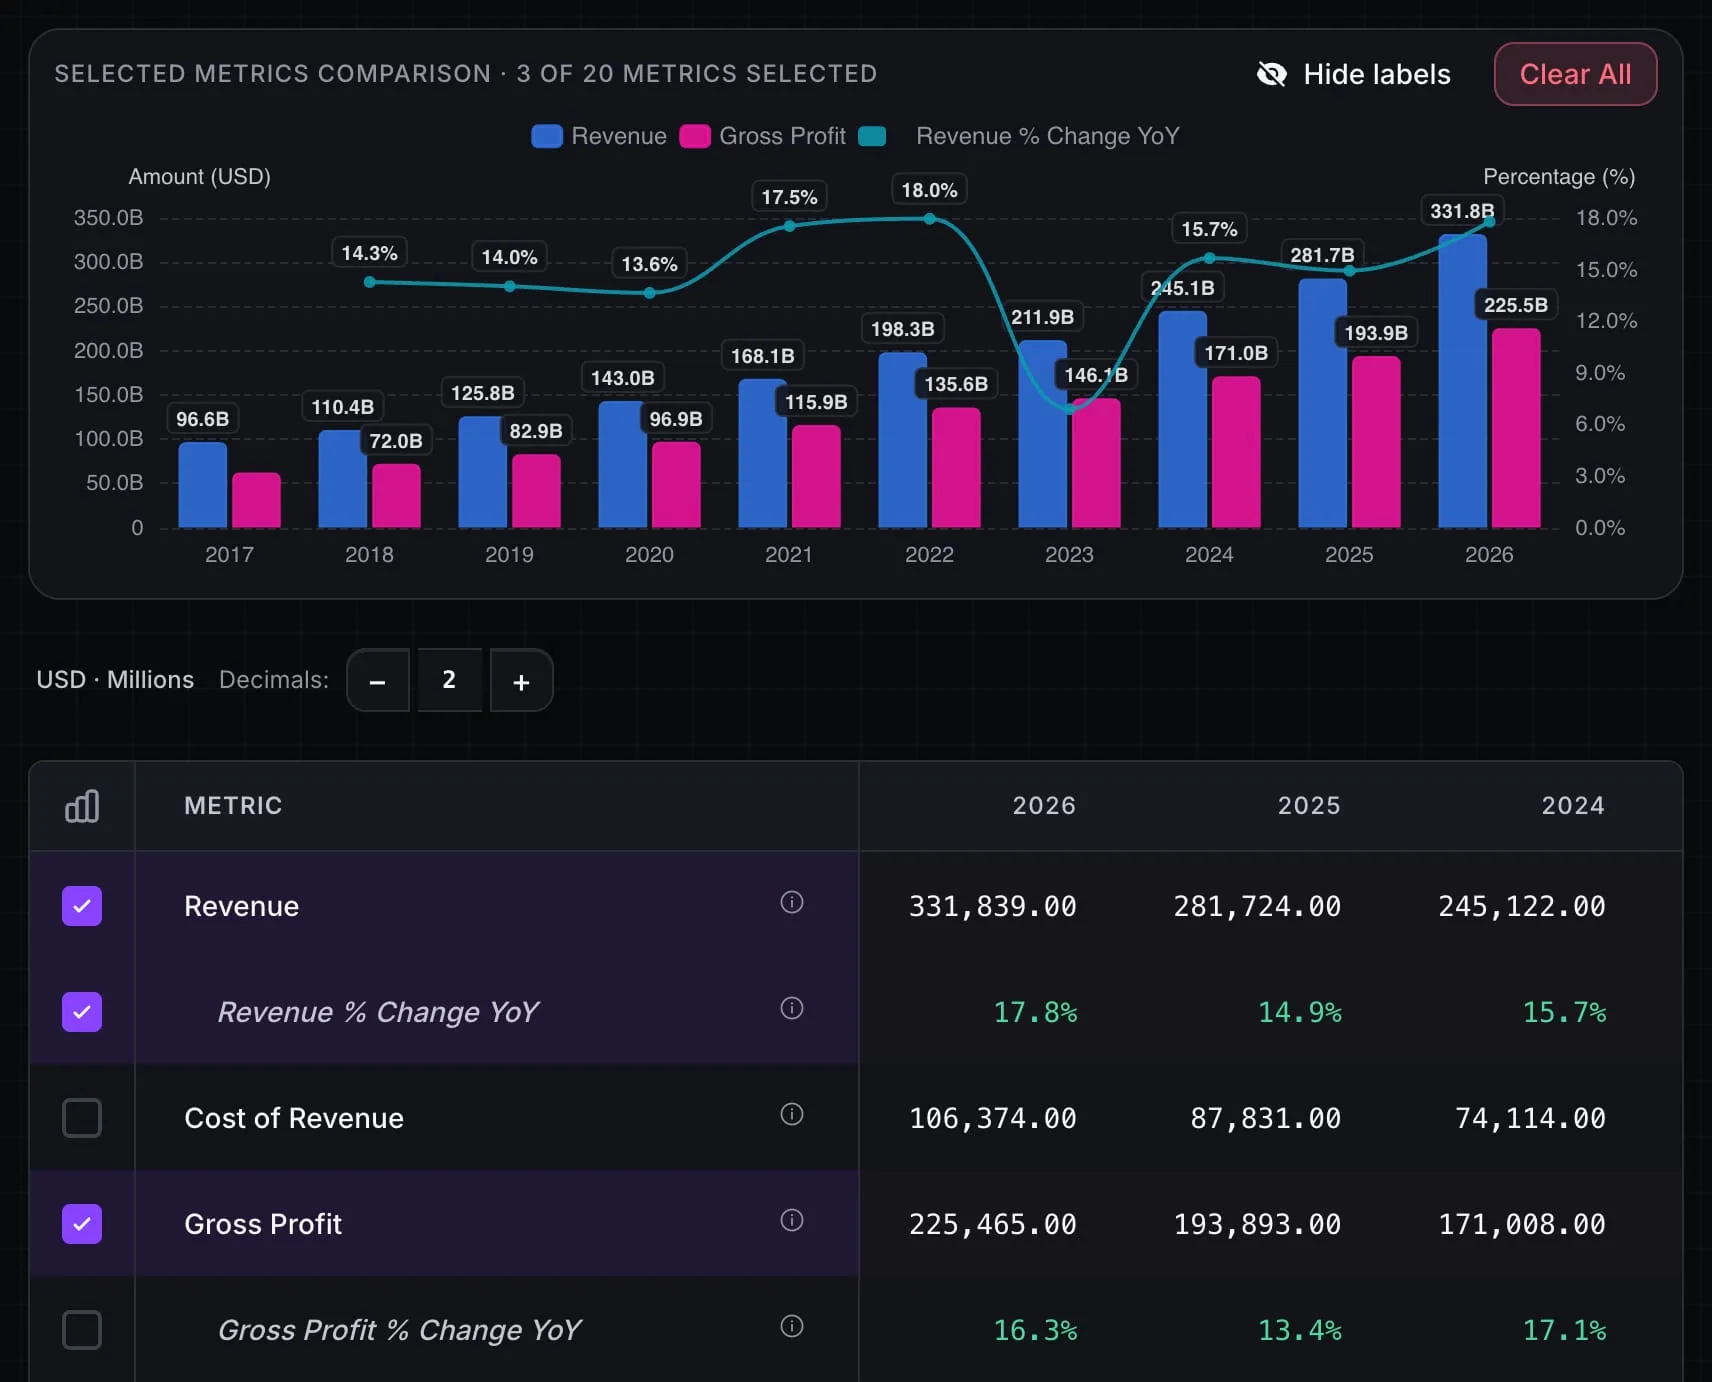
Stok Terminal — ratios and multi-year trends, ready to read.
What you get:
- Your portfolio next to the fundamentals. A multi-currency portfolio, entered by hand or imported from your broker’s file, with realized and unrealized P&L, in the same app where you analyze each company.
- History up to everything available: 7 years on Starter, 15 on Plus and all available on Premium, more than 40 years for some companies.
- Money Flow and capital allocation (Plus and Premium): how revenue turns into net income and where operating cash flow goes.
- Earnings call transcripts on every plan: 3 years on Starter, 10 on Plus and all available on Premium.
- Plus costs €13.90/month$13.90 USD/month, against $34.95 for Morningstar Investor, with a Spanish interface and prices in euros and US dollars.
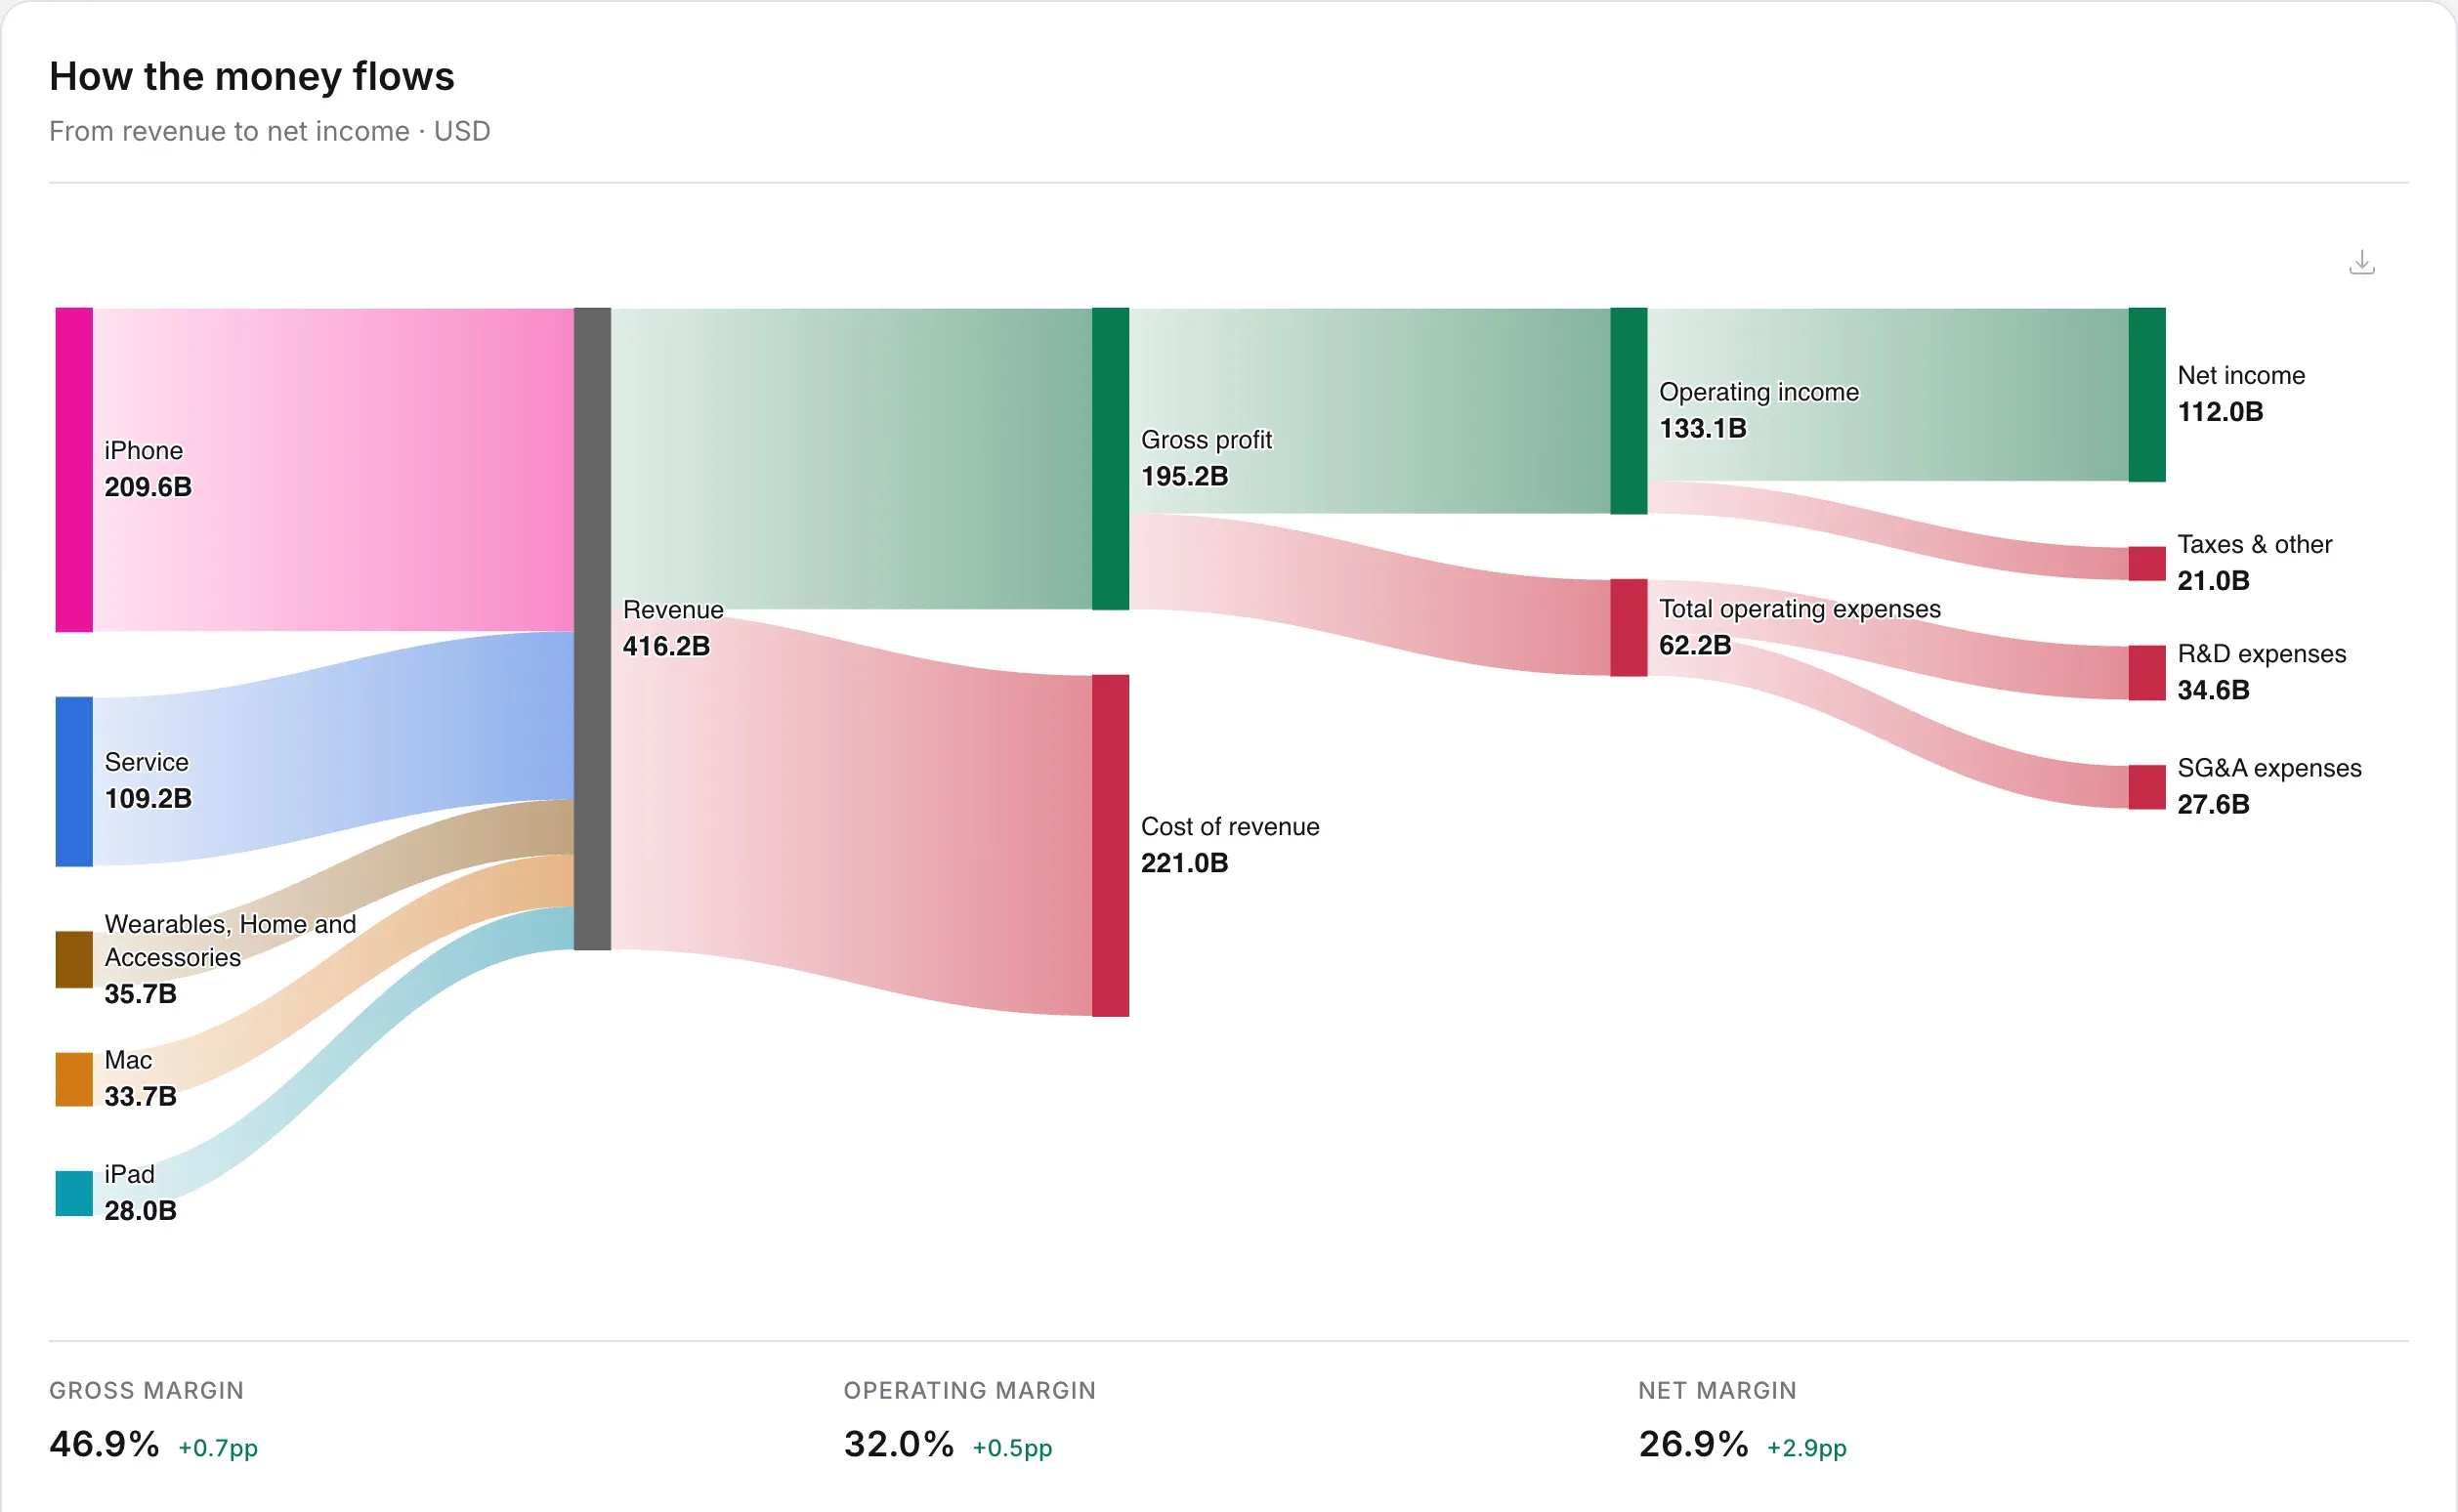
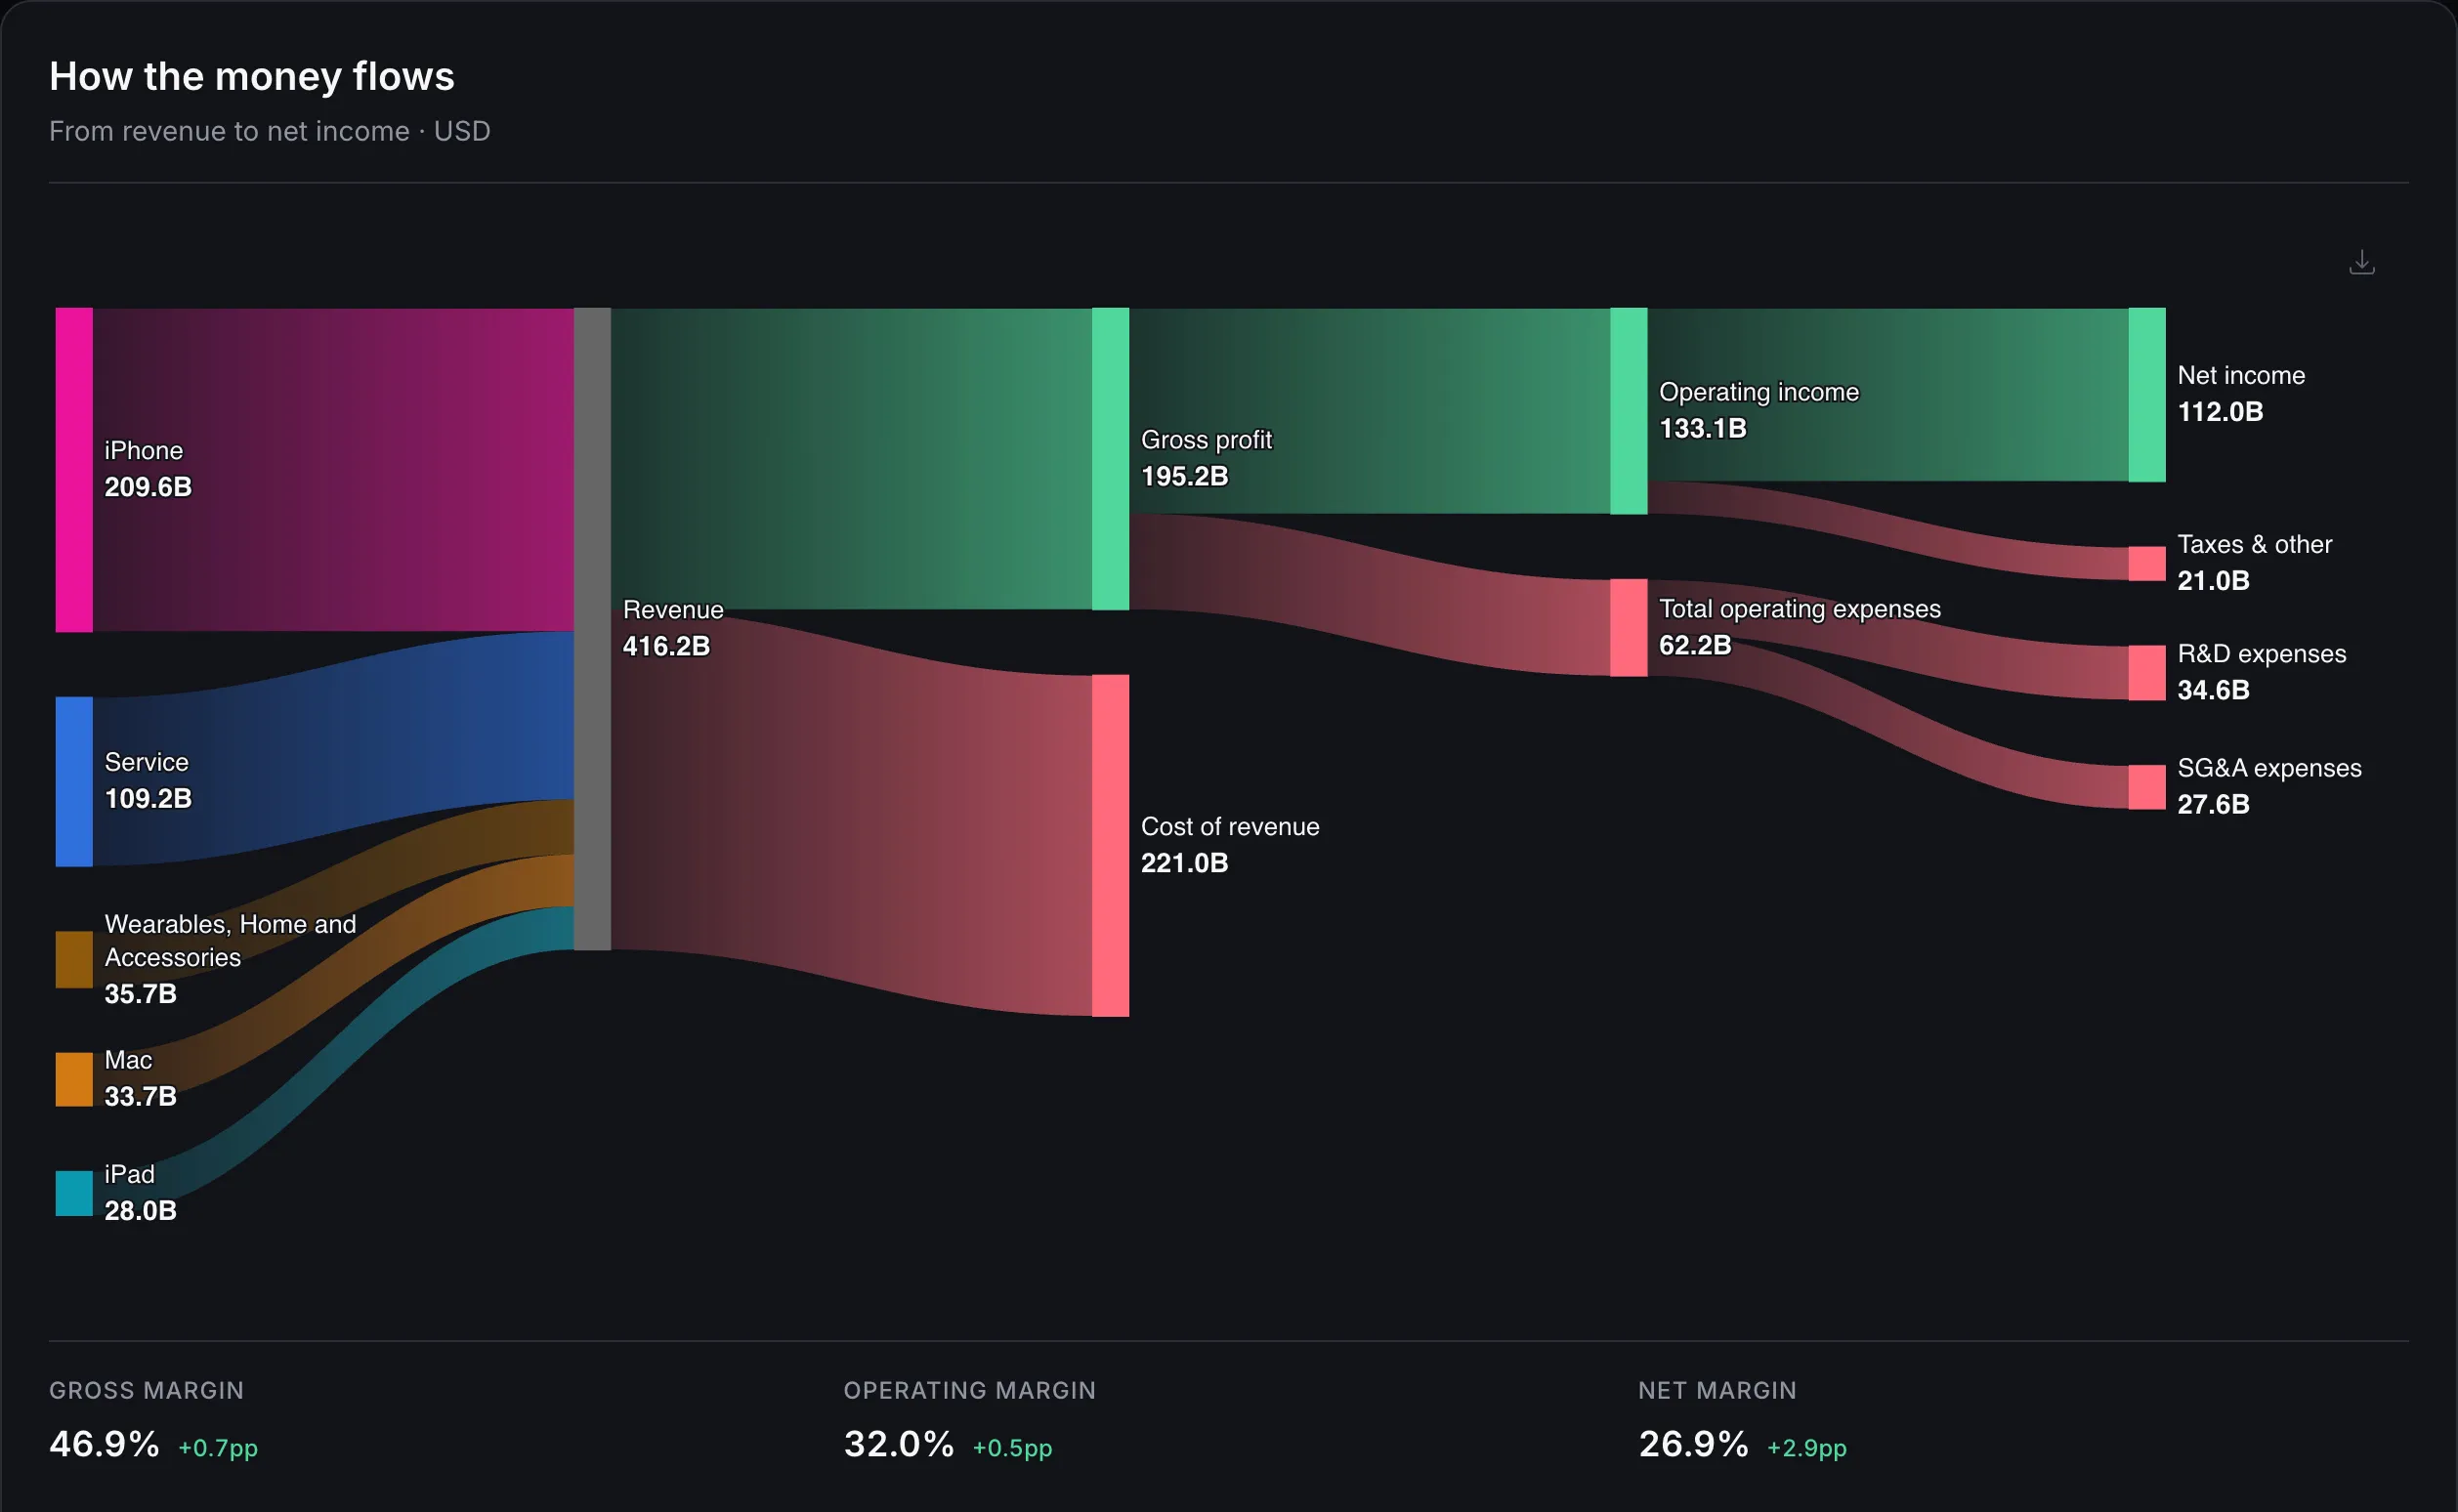
Apple fiscal year 2025: revenue by segment flowing through costs to net income. English interface, captured on 8 November 2026.
Stok Terminal lets you create your account in the app with email and terms acceptance, then verify the code sent to your inbox. Signup does not require a name or password. During launch, the offer gives Starter 10% off monthly or 25% off annual billing, Plus 30% or 40%, and Premium 40% or 50%, respectively. Your tariff keeps the same amount while you remain subscribed. Upgrades and monthly-to-annual switches keep the launch tariff; downgrades and annual-to-monthly switches use the current standard tariff. Cancelling ends it. Choose your plan and provide your card to start the 14-day trial.
Stok Terminal does not write analyst reports, estimate fair value or rate moats: it gives you the data to judge a business yourself.
2. Morningstar Investor — stay if you read the research
Strengths: independent analyst reports with fair value estimates, Economic Moat ratings, star ratings for funds and ETFs, and Portfolio X-Ray for allocation, expense ratios and overlap. If those are what you use, nothing on this list replaces it.
Weaknesses: most of the useful data sits behind the paywall, and the interface is built around reading a conclusion, so following your own metrics across companies and years takes more work.
Price: $34.95/month on monthly billing (checked October 8, 2026).
Best for: investors who read the analyst research and investors who hold several funds.
3. Yahoo Finance Gold — a familiar generalist with long history
Strengths: Silver and Gold add company research reports and fair value analysis, and Gold brings about 40 years of annual and quarterly statements (checked October 8, 2026), inside a site most investors already know.
Weaknesses: the free site is shallow and ad-heavy, the long history only arrives with Gold, which costs more than Morningstar Investor, and there are no Economic Moat ratings.
Price: on monthly billing (checked October 7, 2026), Bronze $9.95, Silver $24.95 and Gold $49.95 per month. More in our Yahoo Finance alternatives.
Best for: investors who want long history inside a familiar generalist.
4. Investing.com / InvestingPro — the generalist with the economic calendar
Strengths: a detailed free economic calendar, broad multi-asset coverage and an interface in Spanish and many other languages. InvestingPro adds deeper company data.
Weaknesses: an ad-heavy free site with shallow fundamentals, and no standard InvestingPro monthly rate we could verify.
Price: the site is free; InvestingPro is not quoted because we could not verify a standard monthly rate. More in our Investing.com alternatives.
Best for: following markets and the macro calendar, more than studying a business in depth.
5. Seeking Alpha — ratings and contributor articles
Strengths: Premium includes unlimited articles and earnings call transcripts, three ratings per stock (Quant, Seeking Alpha authors and sell-side analysts), factor grades for value, growth, profitability, momentum and EPS revisions, 10 years of financials for every stock (5 years on the free account), a screener, a comparison of up to six stocks and portfolios that can sync with a broker account (checked October 9, 2026).
Weaknesses: like Morningstar, it is organized around ratings and other people’s opinions, and its financials stop at 10 years.
Price: Premium is only offered as a yearly subscription, with no monthly plan, so we quote no amount (checked October 9, 2026).
Best for: investors who want to read many opinions on a stock and screen by ratings.
6. Finviz — the fast free screener
Strengths: a fast, visual screener with more than 60 filters on the free tier, heatmaps for a market overview and free portfolios. Finviz Elite adds real-time data, backtesting, CSV export and no ads.
Weaknesses: 3 years of financial statements free and 8 on Elite (checked October 9, 2026), current snapshots instead of multi-year trends, and mostly U.S. coverage.
Price: free; Finviz Elite is $39.50/month (checked October 7, 2026).
Best for: generating ideas and screening, before studying a company somewhere else.
7. Macrotrends — long free U.S. history
Strengths: more than ten years of income statements, balance sheets and cash flow statements for most U.S.-listed companies at no cost, with growth rates on its charts and no login required.
Weaknesses: a slow, ad-heavy site, mostly U.S. coverage, no screener or portfolio, and figures worth cross-checking against the annual report (our 10-K reading guide explains how).
Price: free.
Best for: investors who only need long free U.S. history and accept doing the rest elsewhere.
8. Portfolio Visualizer — analysis of fund and ETF portfolios
Strengths: it backtests portfolios of funds, ETFs and stocks with returns, drawdowns and risk ratios, and shows holdings-based style analysis, allocation by market cap and sector, and each fund’s expense ratio. It also has a fund screener, a fund performance comparison, Monte Carlo simulation and factor regressions. The free plan needs no login and handles portfolios of up to 15 assets with limited history (checked October 9, 2026).
Weaknesses: it has no company financial statements, it is built for asset allocation rather than stock research and its paid plans have no monthly rate.
Price: free; its Basic and Pro plans have no monthly rate, so we do not quote one (checked October 9, 2026).
Best for: fund and ETF investors who want to study the cost, allocation and risk of a portfolio.
9. justETF — ETF research and comparison for Europe
Strengths: an ETF screener focused on the UCITS ETFs sold in Europe, a comparison of up to 20 ETFs side by side and, in the free version, one portfolio and one watchlist with analysis of diversification, cost and risk. The site is available in Spanish, among other languages. Premium adds historic return simulation, detailed analysis, benchmark comparisons and up to 5 portfolios (checked October 9, 2026).
Weaknesses: it covers ETFs, not company fundamentals, and Premium has no monthly billing.
Price: free version; Premium has no monthly plan, so we do not quote one (checked October 9, 2026).
Best for: investors in Spain and the rest of Europe who build their portfolio with ETFs.
10. Simply Wall St — visual summaries
Simply Wall St turns financial data into infographics, scorecards and an automated fair value estimate. It suits beginners who want a visual overview more than a primary research tool; we compare it in detail in Stok Terminal vs Simply Wall St.
11. Koyfin — broad data with dashboards
Koyfin covers equities, ETFs, fixed income and macro data, with customizable dashboards, screening and peer comparison. It suits power users who want that breadth and accept a learning curve; more in our Koyfin comparison.
What Morningstar does well
Its strengths:
- Economic Moat ratings, its framework for durable competitive advantages.
- Independent analyst reports, with valuation models and real opinions on management.
- Fair Value estimates based on DCF, with reports that explain the key assumptions.
- Fund and ETF analysis, where its star ratings remain the reference.
- Portfolio X-Ray, with allocation, expense ratios and overlap across your holdings.
For investors who value analyst opinions and fund analysis, Morningstar Investor delivers real value at its price. If you genuinely use analyst opinions, Economic Moat ratings and fund and ETF research, no tool on this list fully replaces Morningstar. If what you actually use it for is looking at financial data, tracking ratios and making your own decisions, you may be paying $34.95/month for research you do not read.
Morningstar Portfolio X-Ray alternatives
Portfolio X-Ray shows asset allocation, expense ratios and overlap across your holdings. For an investor who owns several funds, the overlap and cost analysis is one of the strongest reasons to keep Morningstar, and no tool in this comparison replaces all of it.
| Tool | What it analyzes | Free | Monthly paid plan |
|---|---|---|---|
| Stok Terminal | Individual stocks: P&L per position; cost, value and allocation on every plan | No free plan | Monthly, from €9.90/month$9.90 USD/month |
| Morningstar Portfolio X-Ray | Allocation, expense ratios and overlap across funds | Not verified | Inside Investor, $34.95/month |
| Portfolio Visualizer | Backtests with expense ratios, style and allocation by market cap and sector | Yes, up to 15 assets with limited history | No monthly plan |
| justETF | ETF portfolios: diversification, cost and risk; up to 20 ETFs compared | Yes, 1 portfolio and 1 watchlist | No monthly plan |
For a fund portfolio, Portfolio Visualizer covers the cost and allocation part for free: it shows each fund’s expense ratio, the style and the allocation, and its fund performance tool compares mutual funds and ETFs. justETF does a similar job for ETFs sold in Europe, with a comparison of up to 20 ETFs. On neither site did we find an overlap report like X-Ray’s (both checked on October 9, 2026).
Stok Terminal covers a narrower part of that job, for investors who hold individual stocks. Its multi-currency portfolio shows realized and unrealized P&L for each position and cost, value and allocation per position on every plan. It does not analyze fund overlap or expense ratios, so if your portfolio is mostly funds and ETFs, Portfolio X-Ray remains the better fit.
How we compared
- Official prices, dated. Koyfin and Simply Wall St were checked on their sites on September 22, 2026; Yahoo Finance and Finviz on October 7, 2026; Morningstar on October 8, 2026; and Seeking Alpha, Portfolio Visualizer and justETF on October 9, 2026. InvestingPro had no standard monthly rate we could verify, Seeking Alpha Premium has no monthly plan, and Portfolio Visualizer and justETF have no monthly billing. We quote monthly rates only.
- Fundamental-analysis focus. We judge each option by what matters for doing your own research: history depth, pre-calculated ratios (ROIC, free cash flow), earnings and the link to your portfolio.
- Only what exists today. Stok Terminal features are listed with the plan that includes them.
- Conflict of interest. We build Stok Terminal and benefit if you choose it. That is why each option says who it is best for, including when that is Morningstar itself.
How to choose
- Want to do your own research, with your portfolio beside it? → Stok Terminal.
- Read the analyst reports and Moat ratings? → Morningstar Investor.
- Want long history inside a familiar generalist? → Yahoo Finance Gold.
- Follow the macro calendar and many asset classes? → Investing.com.
- Want ratings and many written opinions on each stock? → Seeking Alpha.
- Mostly screen for ideas? → Finviz.
- Need long free U.S. history? → Macrotrends.
- Own a portfolio of funds and ETFs and want cost and allocation analysis? → Portfolio Visualizer.
- Build your portfolio with ETFs sold in Europe? → justETF.
- Want visual summaries and an automated verdict? → Simply Wall St.
- Want broad data and dashboards, and accept a learning curve? → Koyfin.
Frequently asked questions
How much does Morningstar Investor cost? $34.95 per month on standard monthly billing (checked on its website on October 8, 2026).
What is the best Morningstar alternative? It depends on what you use Morningstar for. To do your own research with fundamentals, ratios, earnings and your portfolio in one place, Stok Terminal. To keep a familiar generalist with long history, Yahoo Finance Gold. For free long U.S. history and screening, Macrotrends and Finviz.
Is there a good free Morningstar alternative? Macrotrends offers more than ten years of U.S. financial history for free, and Finviz’s free tier is a capable screener. What you give up is Morningstar’s qualitative research and its portfolio tools.
What does Morningstar offer that no alternative replaces? Its analyst reports, Economic Moat ratings and fund and ETF research. If you genuinely rely on those, no tool in this comparison fully substitutes them.
Is there a free alternative to Morningstar Portfolio X-Ray? Partly. Portfolio Visualizer’s free plan needs no login and backtests portfolios of up to 15 funds, ETFs or stocks with limited history, showing each fund’s expense ratio and the allocation by market cap and sector. justETF’s free version includes one portfolio with analysis of diversification, cost and risk for ETFs sold in Europe. Both were checked on October 9, 2026, and on neither site did we find an overlap report like X-Ray’s.
What are Morningstar’s main competitors? For stock research, Yahoo Finance Gold, Seeking Alpha Premium, InvestingPro, Koyfin and Simply Wall St; for free data, Finviz and Macrotrends; for fund and ETF portfolios, Portfolio Visualizer and justETF. Stok Terminal competes in do-it-yourself stock research, with your portfolio in the same app.
Do your own research, with your watchlist and portfolio beside it
Stok Terminal brings company fundamentals, earnings, watchlists and portfolio tracking into one focused workflow, for investors who prefer their own analysis to someone else’s verdict.
Create your Stok Terminal account — and review the current launch offer if the product fits your workflow.
Competitor prices are monthly billing rates checked on each vendor’s official site: Koyfin and Simply Wall St on September 22, 2026; Yahoo Finance and Finviz on October 7, 2026; Morningstar on October 8, 2026; Seeking Alpha, Portfolio Visualizer and justETF on October 9, 2026. InvestingPro, Seeking Alpha, Portfolio Visualizer and justETF appear without a price. Regional pricing may vary; confirm current numbers on each vendor’s site before subscribing.
This article is for information only and is not financial advice.