
Searching for a stock fundamental analysis tool usually means one thing: your current workflow is too fragmented.
Start with the task, not the feature list. A market dashboard, a screener and a research workspace solve different problems. Use this checklist to decide whether you need to find ideas, analyse one business or keep research tied to your watchlist and portfolio.
The fundamentals are in one site. The chart is somewhere else. Your watchlist lives in a broker app. Notes sit in a document. Portfolio context is in a spreadsheet. Every time you want to review one company, you rebuild the same setup.
A good tool should reduce that manual work. It should not pretend to tell you what to buy. It should help you see the business clearly enough to make your own decision.
This guide explains what to look for.
Types of stock analysis tools
“Stock analysis tool” covers products that solve different problems. It helps to know which one you need before comparing prices:
| Type | What it is for | Where it falls short |
|---|---|---|
| General financial portal | Quotes, news and the calendar at a glance | Few years of history and shallow fundamentals |
| Charting platform | Technical analysis, indicators and price alerts | The business shows up as a secondary panel |
| Screener | Filtering thousands of companies to find candidates | Finds companies, but does not help you understand them |
| Fundamental analysis tool | Studying a business in depth and following it over time | Takes time on each company |
If you invest for the long term and pick companies one by one, the last type saves you the most work. The rest of this guide is about it.
Quick answer
A good fundamental analysis tool needs five things: clean multi-year financial statements, ratios that explain quality (not just valuation), context for what the current price implies, watchlists tied to a research thesis, and portfolio tracking connected to that same research — not a separate spreadsheet.
Checklist for choosing a stock analysis tool
| What to look for | Why it matters | How to check it during a free trial |
|---|---|---|
| Ten years or more of statements | A full business cycle does not fit in three years | Open a company you know and look at the first year available |
| Annual and quarterly data | Recent changes show up first in the quarters | Switch the income statement to quarterly |
| ROIC and free cash flow | They measure the quality of the business, not its price | Look for ten years of ROIC in a chart |
| Side-by-side comparison | A number on its own does not tell you if it is good | Put three companies from the same sector in one table |
| Official filings | Figures make more sense next to the original report | Find the latest annual report without leaving the tool |
| A connected portfolio | Research continues after you buy | Import your trades and check the return per position |
Start with the job: research the business
The core job of any fundamental analysis tool is to help you understand the business behind a ticker.
That means it should make these questions easier:
- What does the company do?
- How has revenue grown over time?
- Are margins expanding or shrinking?
- Does profit convert into free cash flow?
- Is debt manageable?
- Is valuation reasonable compared with quality and growth?
- What changed since the last quarter?
If the tool only gives you a price chart and news feed, it is not really a fundamental analysis tool. It may be useful, but it solves a different problem.
For the analysis framework itself, use our fundamental analysis of stocks guide.
Must-Have 1: clean financial statements
Fundamental analysis starts with the three statements:
- Income statement.
- Balance sheet.
- Cash flow statement.
A good tool should make those statements easy to scan across multiple years and quarters. You should be able to see trends without downloading files or copying data by hand.
Important details:
- Multi-year history.
- Quarterly and annual views.
- Clear units and currency.
- Basic per-share data.
- Links or references to official filings when possible.
The cash flow statement deserves special attention. Free cash flow is often more revealing than net income, especially when accounting adjustments distort earnings. We cover the method in free cash flow: how to analyze it.
Must-Have 2: ratios that explain quality
Ratios are useful only if they help you answer a business question. More ratios are not automatically better.
The most useful categories are:
- Profitability: gross margin, operating margin, net margin.
- Returns: ROIC and ROE.
- Balance sheet: net debt, debt/EBITDA, interest coverage.
- Cash flow: FCF margin, FCF conversion, owner earnings.
- Valuation: P/E, EV/EBITDA, FCF yield.
The tool should show trends, not just latest values. A company with ROIC falling from 25% to 12% deserves a different reading than one moving from 8% to 14%.
Start with ROIC and ROE vs ROIC if you want to understand the quality side.
Must-Have 3: valuation context
A tool does not need to deliver a magic fair value. It does need to help you understand what the current price implies.
Useful valuation context includes:
- Historical multiples.
- Peer comparison.
- Free cash flow yield.
- Enterprise value, not only market cap.
- Net debt and cash position.
Valuation is not one number. It is a set of assumptions. A good tool keeps those assumptions visible and connects price to business quality.
For a broader framework, read how to value a company.
Must-Have 4: watchlists with research context
Most watchlists are just quote boards. That is not enough.
A useful watchlist for fundamental investors should answer:
- Why is this stock here?
- What is the thesis?
- What price would make it interesting?
- What changed recently?
- Which fundamentals matter most?
This is where many tools fail. They help you discover stocks but do not help you follow them after discovery. Research is not a one-time event; it is a repeated review process.
We explain the structure in how to build a stock watchlist that actually helps you invest.
Must-Have 5: portfolio context
Fundamental analysis does not stop when you buy. Once a stock is in your portfolio, the question changes:
- Is the original thesis still intact?
- Has position size drifted too high?
- Did valuation become stretched?
- Is new capital better allocated elsewhere?
A tool that separates research from portfolio makes that review harder. You end up knowing the business in one place and the portfolio impact in another.
That connection matters most for independent investors who manage their own process without an analyst team.
What you do not need
Not every feature helps fundamental analysis. Be careful with:
- Real-time minute charts if you invest over years.
- Social sentiment feeds.
- Black-box buy/sell ratings.
- Overloaded dashboards with dozens of unactionable metrics.
- News feeds that reward constant checking.
The best tool is not the one with the most widgets. It is the one that helps you answer your investment question with less friction.
How Stok Terminal covers each must-have
None of this replaces judgment — a tool only reduces the busywork between “this company is worth studying” and “I understand what changed.” We built Stok Terminal around the five must-haves above because we kept rebuilding the same fragmented setup ourselves; it is one way to cover them, not the only one.
- Financial statements: income statement, balance sheet and cash flow, annual and quarterly, with 7 years on Starter, 15 on Plus and all available history on Premium (more than 40 years for some companies). Up to 20 metrics in one chart, and every SEC filing with a form filter.
- Quality ratios: an explorer of 75 profitability, valuation and balance-sheet ratios, as annual, quarterly or daily series.
- Valuation context: daily multiples computed only from the accounts published by each date, analyst consensus, earnings versus estimates and earnings call transcripts.
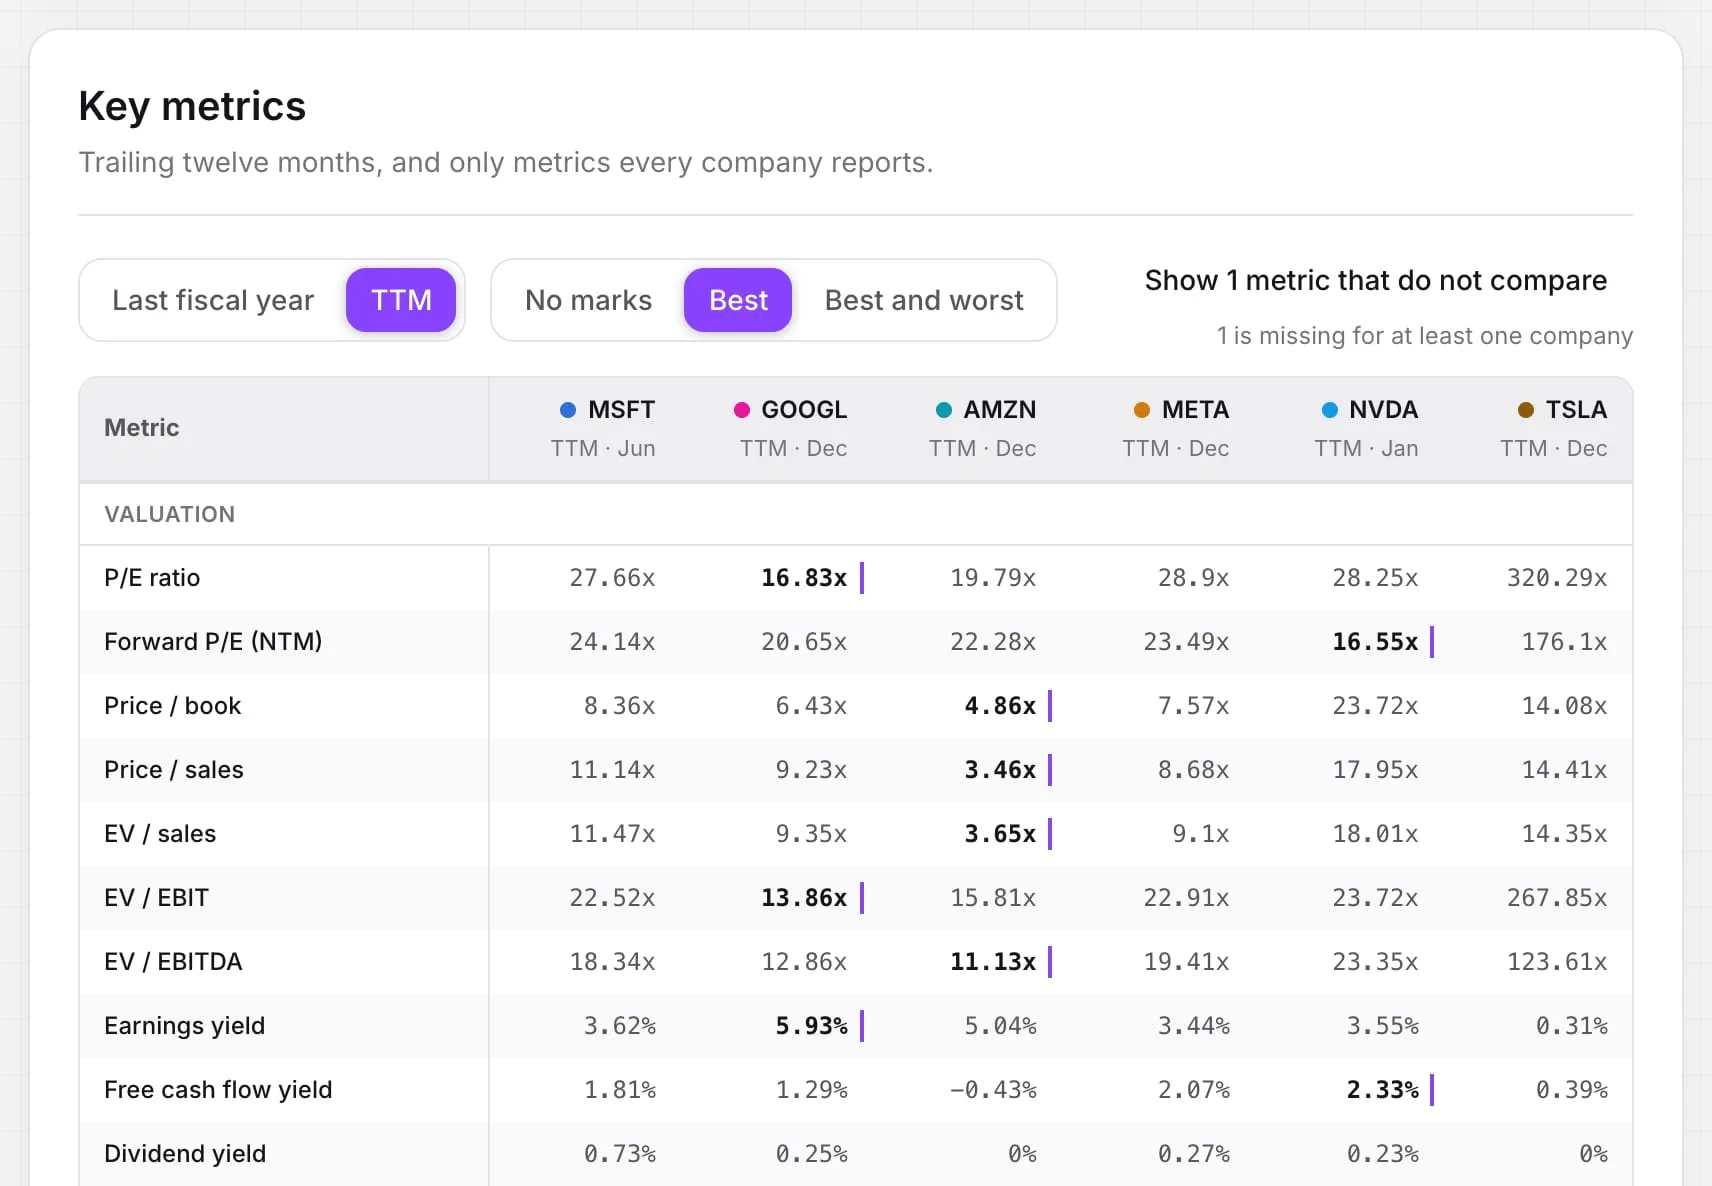
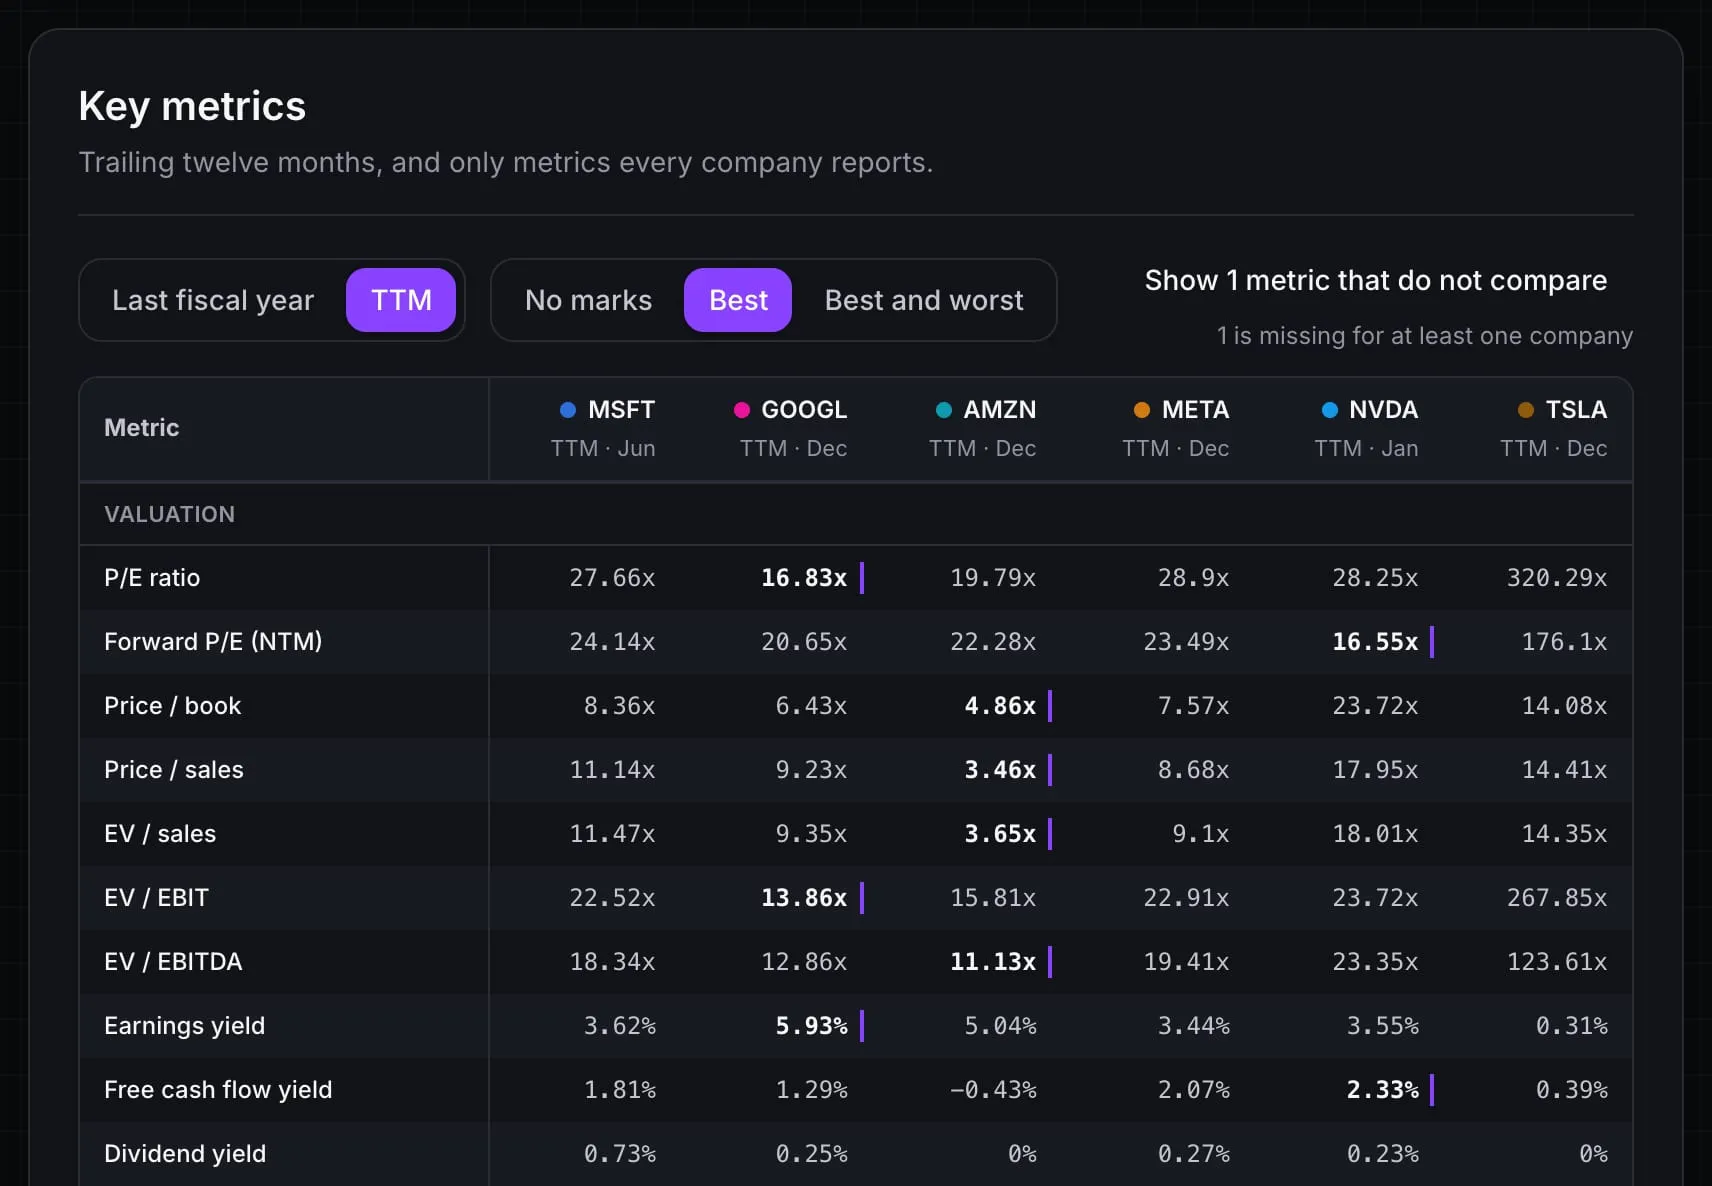
- Comparison: 2, 4 or 6 companies side by side depending on the plan, with the best and worst value of each metric marked.
- Watchlists and portfolio: watchlists with columns (customizable from Plus), notes with tags, and a multi-currency portfolio entered by hand or imported from your broker’s file, with full analytics from Plus.
What it does not have yet: a screener, alerts or a valuation model of its own. The screener and alerts are in development.
Frequently asked questions
What should a stock fundamental analysis tool include? At minimum: financial statements, key ratios, valuation context, historical trends, watchlists, company documents and a way to connect research with portfolio decisions.
Is a free stock analysis website enough? It can be enough for quick checks, but serious research usually needs cleaner statements, better context, fewer distractions and a repeatable workflow.
What is the difference between a stock screener and a fundamental analysis tool? A screener helps you find candidates. A fundamental analysis tool helps you understand, compare, monitor and decide what to do with those candidates.
Is Stok Terminal a fundamental analysis tool? Yes. Stok Terminal is built as a stock research app for independent investors, combining company fundamentals, watchlists, portfolio tracking and market context.
This article is for informational purposes only and does not constitute financial advice or investment recommendations.
A cleaner fundamental research workflow
Stok Terminal brings fundamentals, watchlists and portfolio context into one place for independent investors.
Join the Stok Terminal launch list free — early access opens in signup order.