TradingView is probably the best charting platform in the world for retail investors. And precisely because of that, a lot of people end up trying to use it for something it was never designed for: fundamental analysis.
If you have opened TradingView trying to understand a business — a decade of margins, return on invested capital, debt and its maturities, the cash it actually generates — you know the feeling: the data is somewhere, but the tool keeps pulling you back to the chart. That is not a flaw. TradingView is built for traders, and it serves them brilliantly.
This article is published by the STOK Terminal team. We are building a fundamental analysis app and it appears in the comparison — with transparency about its current state (early access via waitlist) and open credit for what TradingView does better than anyone.
Quick answer: for charts, technical analysis and following markets, stay on TradingView — it is the reference. For serious fundamental analysis, complement it (or replace it) with a specialized tool: Macrotrends + Finviz if your budget is zero and your universe is the US, or STOK Terminal if you want multi-year fundamentals connected to watchlists and portfolio (early access, €6.95/month on activation).
Related: Yahoo Finance alternatives · Investing.com alternatives · How to compare two companies
What TradingView Does Better Than Anyone
Credit where due, because it is a lot:
- The best charts in retail. Smooth, customizable, with dozens of chart types and hundreds of indicators. Nobody matches them at the price.
- Enormous multi-asset coverage: global stocks, indices, FX, crypto, commodities, bonds.
- A giant community of published ideas, scripts (Pine Script) and user-built indicators.
- A genuinely useful free plan for basic charting and watchlists.
- Fast, well-executed alerts and screeners.
If you trade — swing, intraday, technicals — TradingView is probably already home, and rightly so. This article is not about that.
Where It Falls Short for Fundamental Analysis
The issue is not that TradingView lacks fundamental data: it has per-company financial statements and fundamental filters in the screener. The issue is that the entire flow is built around price, not the business:
- The chart is the center; fundamentals are a side panel. The tool’s natural path leads you to draw on candles, not to compare a decade of margins or cash conversion. You can consult the income statement, but working with it — normalizing years, lining it up against a comparable, connecting it to your thesis — is not the easy path.
- Paying more doesn’t buy more fundamental depth. Look at what scales across its paid plans: more charts per tab, more indicators, more alerts, finer intraday data. In other words: the premium tiers are designed for traders. A €59.95/month Premium gets you 8 charts and 400 alerts — not a DCF or deeper ROIC history.
- The community pushes toward the short term. Published “ideas” are overwhelmingly technical analysis. If your horizon is years, the noise of supports, resistances and bull flags is exactly that: noise.
- It doesn’t connect fundamentals to your portfolio. You can track positions, but the fundamental investor’s key question — how are the businesses I own evolving? — has no screen of its own.
- Key metrics are not first-class citizens. ROIC, FCF yield, cash conversion, net debt with its maturity schedule — the metrics that separate a quality business from a trap (we explain them here) — are not what the interface is organized around.
In short: TradingView is a great place to look at the price and an awkward place to study the business. For a trader, perfect. For a fundamental investor, not enough.
What TradingView Costs (Checked July 4, 2026)
Prices verified today on its official website (EU version, shown in euros):
| Plan | Price | What scales |
|---|---|---|
| Basic | Free | 1 chart per tab, 2 indicators |
| Essential | €12.95/month | 2 charts, 5 indicators, 20 alerts |
| Plus | €29.95/month | 4 charts, 10 indicators, 100 alerts |
| Premium | €59.95/month | 8 charts, 25 indicators, 400 alerts |
| Ultimate | €199.95/month | 16 charts, 50 indicators, 1,000 alerts |
(Additional discount if you pay annually. Prices change with promotions and by region: verify at tradingview.com before subscribing.)
Look at the right-hand column: everything that scales as you pay more is trading capacity. It is the confirmation, in its own pricing, of who the tool is built for.
The Alternatives, Depending on What You Need
Macrotrends + Finviz — the free combo
Macrotrends offers 10–20 years of financial statements for US companies for free, with simple charts of margins and ratios. Finviz is the reference free screener. Both US-centric, neither with serious watchlists or portfolio — but at zero cost they cover exactly what TradingView doesn’t: long fundamental history.
Pick it if: zero budget, US universe, and you don’t mind hopping between sites.
Yahoo Finance / Investing.com — the generalists
Quotes, news and basic fundamentals for free (with ads). Fine for quick checks; shallow for deep analysis, for reasons we covered in detail: Yahoo Finance alternatives and Investing.com alternatives.
Pick it if: you want a generalist to follow markets, not an analysis tool.
STOK Terminal — the full fundamental workflow
STOK Terminal is currently in early access, opened from a free list in signup order. Joining the list is free and creates no charge; we say so upfront. Early users pay €6.95/month once they activate their access — a 50% discount off the €13.90 public price — and keep that 50% discount on the future public price while their subscription remains active. If they cancel and return later, the then-current price will apply. Nothing is charged while you wait on the list, and the trial only starts when you accept your invitation.
We are the opposite of TradingView, on purpose: the center is not the chart, it is the business.
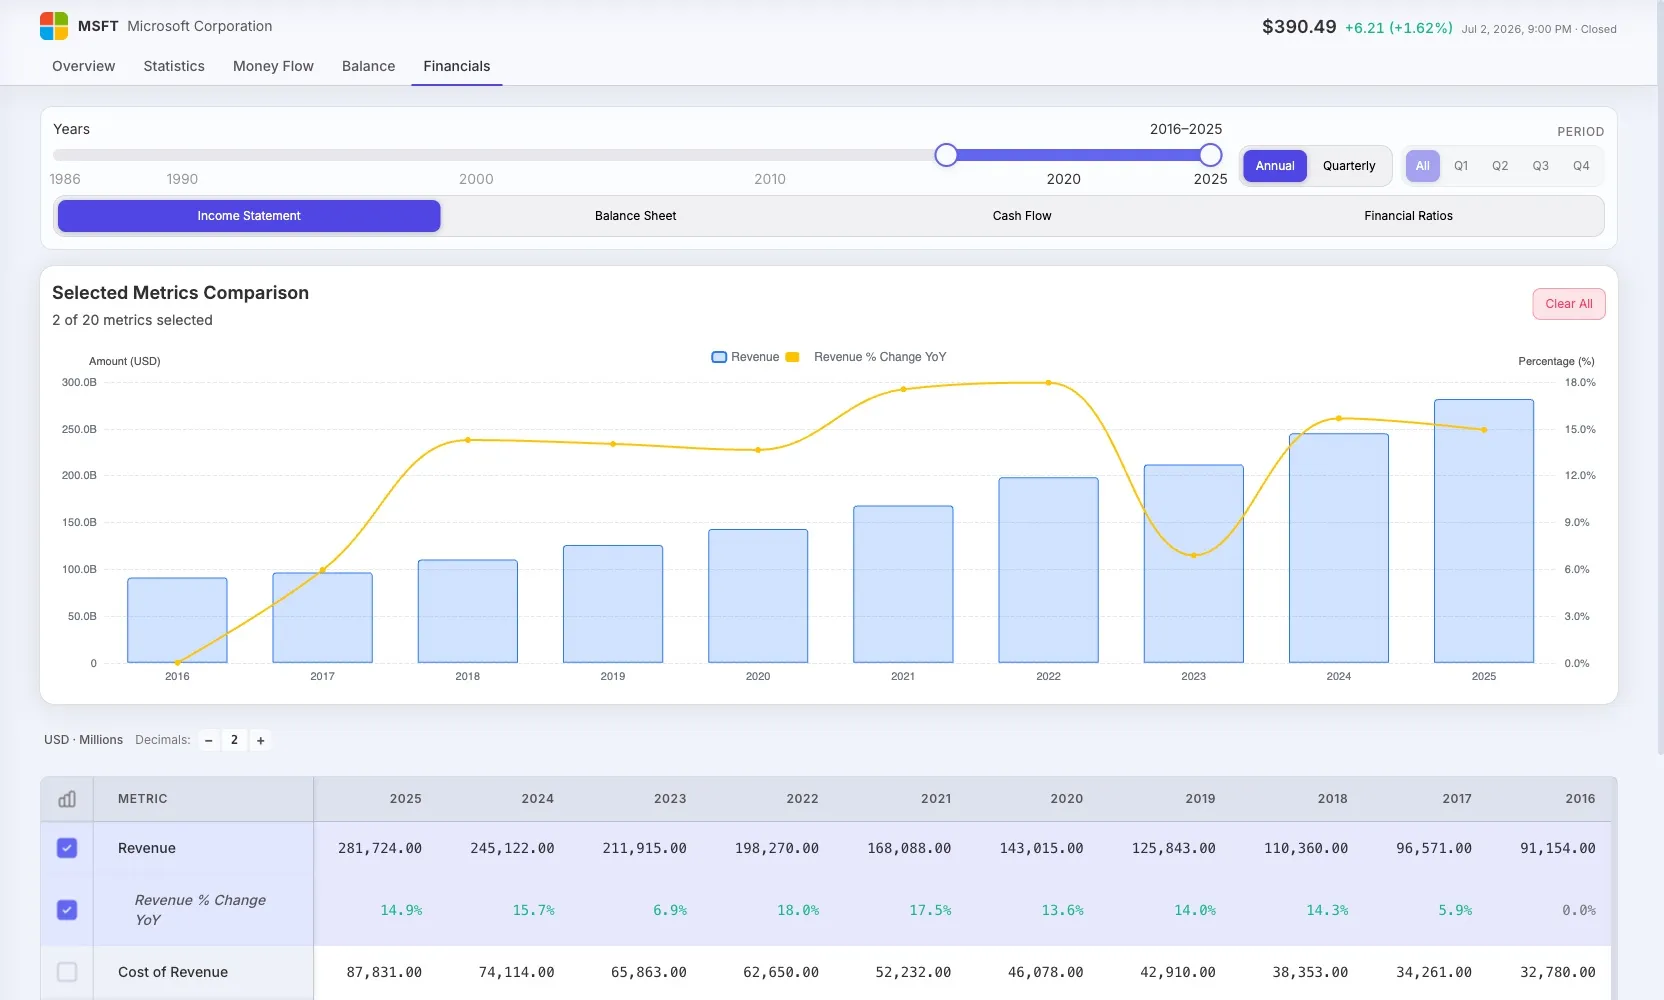
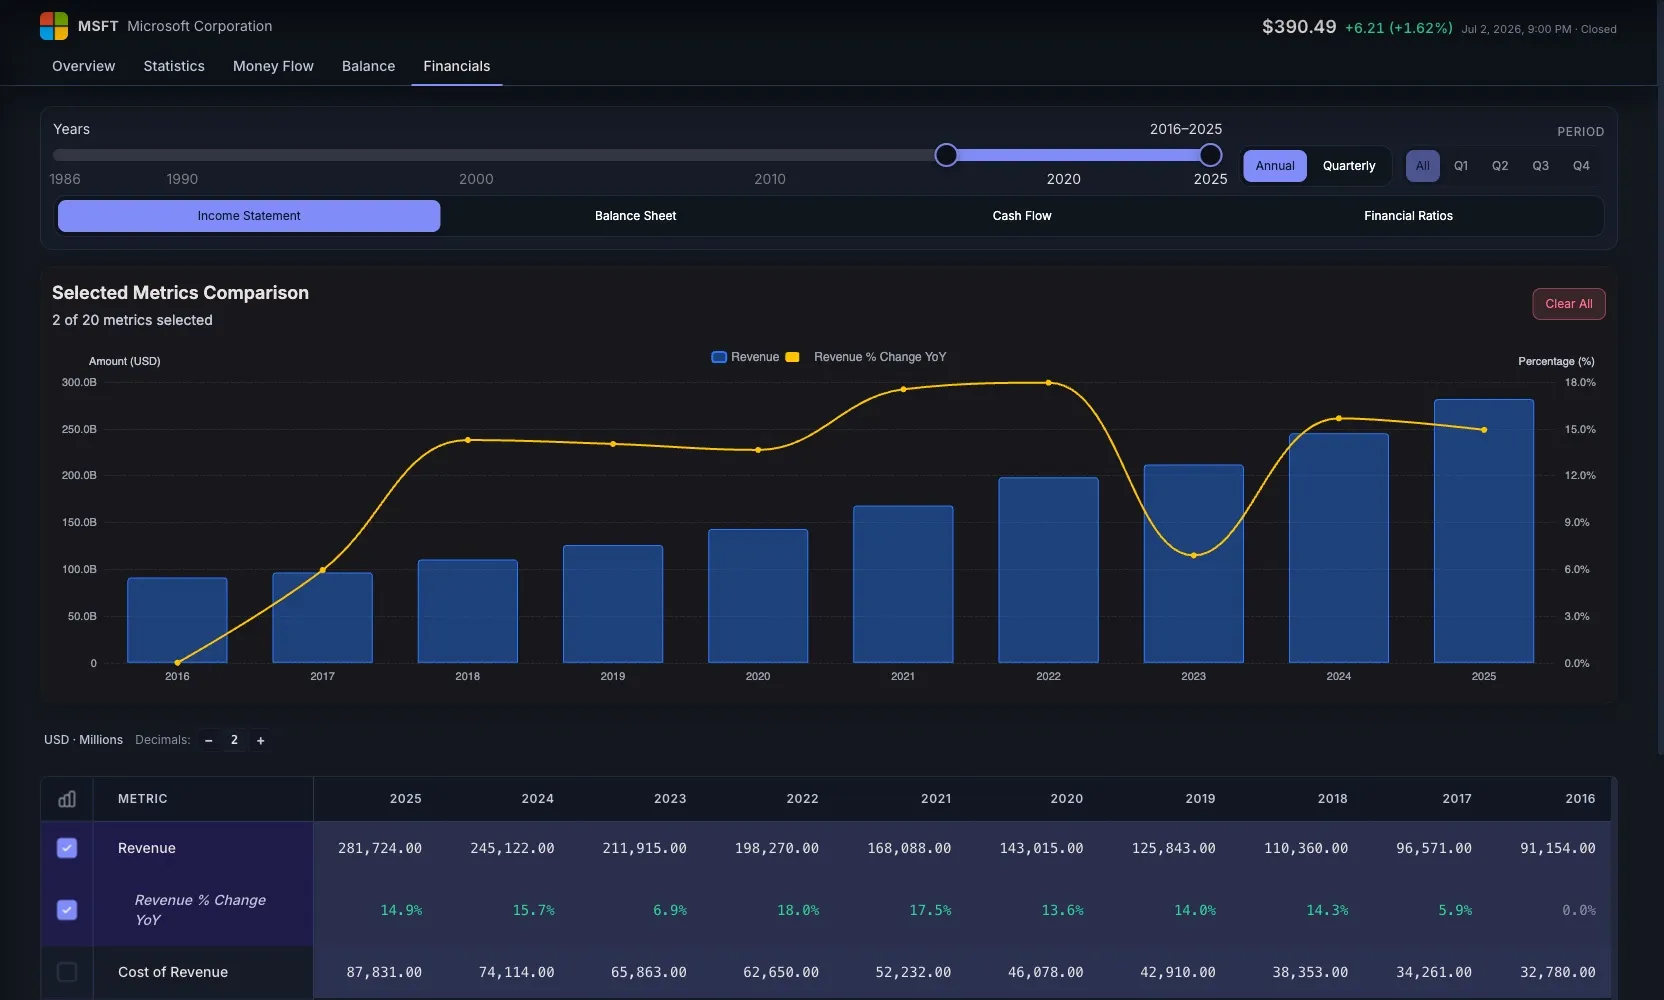
- Company Fundamentals — income statement, balance sheet, cash flow and ratios per company — annual and quarterly, up to 30+ years of history depending on company and plan — in side-by-side comparable tables.
- Documents & notes — open filings like the 10-K or annual reports and keep per-company notes, with history and links, without leaving the company page.
- Watchlists connected to the company page — from list to analysis in one click (our watchlist framework).
- Portfolio with fundamentals — your positions with a full transaction ledger, next to the business data of what you own.
- Market Overview — market context as a starting point, not an infinite feed.
- Pricing: €6.95/month for early users on activating access (50% off the €13.90/month public price), with a 14-day free trial.
What we are not: a trading platform or an intraday alerts engine. We include an advanced candlestick chart, but we don’t compete with TradingView’s thousands of indicators and community scripts. If you trade, TradingView will serve you better. If you study businesses, this is our ground.
Using TradingView for the chart but missing the business side? Join STOK Terminal free — multi-year fundamentals, watchlists and portfolio in one flow.
TradingView + a Fundamental Tool: the Realistic Combo
Honestly: for many people the answer is not “TradingView or a fundamental tool” — it is both, each in its role:
- Study the business in your fundamental tool: 5–10 years of revenue, margins, free cash flow, debt and returns on capital.
- Form your thesis and your price range (how to compare two companies gives you the framework).
- Use the chart — on TradingView or anywhere — for price context and little more. On a multi-year horizon, the chart is the last question, not the first.
The expensive mistake is the reverse: starting from the chart, falling in love with a technical pattern, and rationalizing the business afterwards. If that has happened to you, you are not alone — it is the bias that a trading tool’s entire interface feeds.
If you want the detailed head-to-head between the two tools in that combo, we break it down in STOK Terminal vs TradingView.
How to Decide
- Do you trade or do technical analysis? → TradingView, no hesitation.
- Fundamental analysis with zero budget and a US universe? → Macrotrends + Finviz.
- Following markets in general? → Yahoo Finance or Investing.com (with their limits).
- Studying businesses seriously — fundamentals, watchlists and portfolio in one flow? → STOK Terminal.
- Both? → TradingView for the chart + a fundamental tool for the business. It is the most common combo among investors who also trade.
Frequently Asked Questions
Can you use TradingView for fundamental analysis? Partially. It shows financial statements and has fundamental filters in its screener, but the entire workflow is designed around the chart: it is a trader’s tool. For studying a business in depth — multi-year trends in margins, ROIC, cash and debt connected to your portfolio — it falls short of specialized tools.
How much does TradingView cost in 2026? Checked on its official website on July 4, 2026 (EU version, shown in euros): free Basic plan, Essential €12.95/month, Plus €29.95/month, Premium €59.95/month and Ultimate €199.95/month, with an additional discount for annual billing. Prices change; always verify at tradingview.com.
What do TradingView’s paid plans actually add? Mostly trading capacity: more charts per tab, more indicators, more alerts, finer intraday data. Paying more does not buy deeper fundamental analysis — which tells you who the product is built for.
What should I use for fundamental analysis instead of (or alongside) TradingView? It depends on the workflow: Macrotrends and Finviz cover long history and screening for free (US-focused); STOK Terminal connects multi-year fundamentals, watchlists and portfolio in one flow (early access, €6.95/month on activation). Many investors use TradingView for the chart and another tool for the business.
The Chart Tells You the Price. Fundamentals Tell You If It’s Worth It.
STOK Terminal brings fundamentals, watchlists and portfolio tracking into one focused workflow — built for independent investors who care about the business, not the noise.
👉 Join STOK Terminal free — 14-day free trial when you activate, 50% discount for as long as your subscription stays active.
TradingView prices were checked on its official website (EU version, shown in euros) on July 4, 2026; other tools’ pricing is covered in the linked comparisons. All of them can change with promotions or by region — we don’t know how they will evolve, so confirm current numbers on each provider’s website before subscribing. This article is informational and not financial advice.