Investing.com is one of the most visited financial websites in the world. Millions of investors use it daily for real-time quotes, the economic calendar and market news. It is free, massive, and covers practically every financial instrument on the planet.
But if you have spent more than five minutes on the free Investing.com trying to actually analyze a stock, you already know what is coming: ads. Pop-ups. Push notification prompts. Sponsored content next to real content. The data is there, buried somewhere, but the experience makes you want to close the tab.
This article is published by the STOK Terminal team. We are building a fundamental analysis app for independent investors and we will include it in the comparison — but we will be transparent about its current state (early access via waitlist) and fair to every option, including Investing.com itself. Competitor pricing was verified against official sources between May and July 2026.
Quick answer: if you want an Investing.com alternative for charts and trading, the answer is TradingView (free; Essential €12.95/mo). For a less ad-heavy generalist, Yahoo Finance. If you upgrade for fundamental depth, weigh InvestingPro Pro+ ($34.99/mo) against Koyfin Plus ($49/mo), TIKR (from $24.95/mo) and Yahoo Finance Gold ($39/mo). For clean, multi-year fundamentals — up to 30+ years of history — tied to your watchlists and portfolio, STOK Terminal (early access, €6.95/mo once access is activated) is the focused alternative.
Related: Yahoo Finance alternatives · TradingView for fundamental analysis · TIKR and Koyfin alternatives · Can ChatGPT and Gemini actually analyze stocks?
Investing.com Alternatives — Comparison Table (Updated July 2026)
| Tool | Best for | Premium price (monthly) | Fundamental history | Economic calendar | Pre-calc ROIC & FCF | Portfolio tracking |
|---|---|---|---|---|---|---|
| Investing.com | Economic calendar and news | Pro $13.99 · Pro+ $34.99/mo | Few years free | Excellent (free) | Yes (Pro+) | Basic |
| TradingView | Charts and trading | Essential €12.95 / Plus €29.95 / Premium €59.95/mo | Limited (price-focused) | Good | No | Basic |
| Yahoo Finance | Less ad-heavy generalist | Bronze $9.95 / Silver $24.95 / Gold $39/mo | ~5 quarters free | Basic | Premium-gated | Basic |
| Koyfin | Bloomberg-style depth | Plus $49/mo | 2 yrs free | Good | Yes | Limited (paid) |
| TIKR | Raw fundamental data | From $24.95/mo | Limited free | No | Yes | Secondary |
| Finviz | Screening and idea generation | Elite $39.50/mo | Current only | No | Partial | No |
| Simply Wall St | Beginners who want visuals | Premium $10.95 · Unlimited ~$21.50/mo | 5 reports/mo free | No | Yes (limited) | Limited |
| Morningstar | Analyst reports and funds | Investor $34.95/mo | Limited free | No | Yes (premium) | Portfolio X-Ray |
| Macrotrends | Free long-history U.S. data | Free (some premium add-ons) | 10–20 yrs U.S. | No | Yes | No |
| STOK Terminal | Fundamentals + portfolio in one flow | Early access · €6.95/mo once access is activated | Up to 30+ yrs (plan-dependent) | No (by design) | Yes | Yes, integrated |
The rest of the article unpacks what this table summarizes: what Investing.com does well (and badly), each alternative’s strengths and weaknesses, and how we verified every price.
What Investing.com Does Well
Credit where it is due. Investing.com has built genuinely impressive things in several areas:
- The economic calendar is the best free economic calendar available — earnings dates, central bank decisions, GDP releases, employment data, all in one place with real-time updates, filters and historical data. Many professional traders use it daily.
- Massive multi-asset coverage — stocks, forex, commodities, crypto, bonds, indices, ETFs, funds across global markets.
- Free real-time or near-real-time quotes for many instruments.
- Functional technical analysis tools with a decent range of indicators.
- A widely used mobile app with real-time alerts, portfolio tracking and market news.
- An active community in comments and sentiment indicators.
For traders who need broad market data and a global economic calendar, Investing.com delivers.
Where Investing.com Falls Short for Fundamental Analysis
The frustration hits when Investing.com is used for fundamental analysis — the process of evaluating a company’s financial health, not just its price movements.
- The advertising is overwhelming on the free tier. Banner ads, video ads, push notification prompts, sponsored “analysis” mixed with real content. Concentrating on a balance sheet is hard when the page is actively fighting for your attention.
- Free fundamental data is shallow. The site is built for technical analysis and news. Free financial statements are typically limited to a few years, and key metrics like ROIC or FCF Yield are not pre-calculated.
- News quality is uneven. The platform aggregates from many sources, and the line between editorial content, user analysis and sponsored articles can be blurry.
- Push notifications are aggressive and the prompts to enable them are relentless.
- Free portfolio tracking is basic — no fundamental analysis of your holdings, no way to see which positions have deteriorating financials or improving margins.
- No structured research workflow — the site is optimized to keep you clicking through pages, not to streamline analysis.
Investing.com’s Own Premium Product: InvestingPro
It is fair to say that InvestingPro is a genuinely different product from the free Investing.com experience. As of May 2026 there are two tiers:
- Pro — $13.99/month. 100+ fundamental metrics, ProPicks, ProTips, peer comparison, fair value estimates and an ad-free experience.
- Pro+ — $34.99/month. Everything in Pro plus 1200+ metrics, 10-year financial history, a stock screener, customizable metric views, data export and fundamental charts.
For a regular Investing.com user, upgrading to Pro+ is often the cleanest fix for the ad and depth problems of the free site.
That said, several alternatives below either match Pro+ on fundamentals or beat it on workflow, so it is worth comparing.
What to Look For in an Investing.com Alternative
Before comparing options, the things that matter for fundamental analysis:
- Real historical depth — 10+ years of statements ideally, to cover a full cycle.
- Key ratios ready to use — ROIC, FCF Yield, margins, debt ratios pre-calculated. See our ROIC guide and Free Cash Flow guide for why.
- Visualization of multi-year trends, not just data tables.
- A clean, ad-free interface that lets you focus.
- A portfolio view that connects to fundamentals, not just prices.
- Reasonable pricing. Bloomberg costs $24,000/year. A retail tool should not.
The Best Investing.com Alternatives Compared (2026)
TradingView — The Most-Searched Alternative, Built for Traders
TradingView is the first name that comes up in any comparison against Investing.com, and for good reason: it is the global reference for charting, with a huge community of traders.
Strengths:
- The best charts in retail investing, with thousands of indicators and community scripts.
- A genuinely usable free Basic plan, without Investing.com’s ad bombardment.
- Pricing verified in July 2026 (EU version, shown in euros): Essential €12.95/month, Plus €29.95/month, Premium €59.95/month, with an additional discount for annual billing.
- Active community and multi-asset coverage comparable to Investing.com’s.
Weaknesses:
- Paying more does not buy fundamental depth. The premium tiers scale charts per tab, indicators and alerts — trader features. A €59.95/month Premium gets you 8 charts and 400 alerts, not better ROIC history or a DCF.
- Financial statements are a secondary panel, with no side-by-side multi-year tables.
- No economic calendar at the level of Investing.com’s.
We cover this case in depth in TradingView for fundamental analysis: what it lacks and how to complement it.
Best for: Traders and technical analysis. Most fundamental investors end up using TradingView for the chart and another tool for the business.
Yahoo Finance — Free Familiarity, Real Premium Depth
Yahoo Finance is the most common starting point for retail investors and a direct alternative to Investing.com’s free experience.
Strengths:
- Massive market coverage across all asset classes.
- Less aggressive ad experience than Investing.com (though still ad-supported on free).
- Premium tiers — Bronze $9.95/month, Silver $24.95/month, Gold $39/month. Gold opens long-history exportable annual and quarterly financial data.
- A widely used mobile app and good news feed.
Weaknesses:
- Free tier is shallow on fundamentals.
- Even on premium, the workflow is less polished than dedicated research tools.
Best for: Investing.com regulars who want a less ad-heavy generalist alternative.
Koyfin — Closest to Bloomberg, Steep Learning Curve
Koyfin is the closest thing to a Bloomberg terminal that retail investors can afford.
Strengths:
- Excellent depth — 10+ years of statements on the paid tier, multi-asset coverage, customizable dashboards.
- A surprisingly generous free tier — 2 years of financials, 2 watchlists, 2 screens, 2 dashboards, 1 year of forward estimates and a global screener.
- Strong peer comparison tools.
Weaknesses:
- Koyfin Plus is $49/month on monthly billing — noticeably pricier than InvestingPro Pro+.
- The learning curve is real. Expect hours of setup.
- No analyst reports.
- No economic calendar comparable to Investing.com’s.
Best for: Power users who want deep data and don’t mind investing time to learn.
TIKR — Raw Fundamental Data at the Best Price
TIKR is the favorite alternative for fundamental investors on a budget: deep financial data at a fraction of the price of Koyfin or InvestingPro Pro+.
Strengths:
- Deep fundamental history with global coverage, including European listings.
- Earnings call transcripts, something neither Investing.com nor most of this list offers.
- Competitive pricing among the deep-data tools: paid plans start at $24.95/month — below InvestingPro Pro+ and Koyfin.
Weaknesses:
- Utilitarian interface: dense tables, little visualization.
- No economic calendar, and portfolio tracking is a secondary feature.
We compare it in detail in TIKR and Koyfin alternatives.
Best for: Fundamental investors who want raw data at the best price.
Finviz — Clean Screener, Limited Fundamentals
Finviz is a fast, visual stock screener that excels at filtering and idea generation.
Strengths:
- Excellent screener with 60+ filters, fast and intuitive.
- Heatmaps for instant market overviews.
- A genuinely useful free tier.
- Much cleaner interface than Investing.com.
Weaknesses:
- Almost no historical fundamental data — only current snapshots, no multi-year trends.
- Finviz Elite is $39.50/month. Elite adds real-time data, pre-market, backtesting and an ad-free experience — but does not solve the depth problem.
Best for: Screening and idea generation, not deep analysis.
Simply Wall St — Visual and Approachable, Oversimplified
Simply Wall St takes financial data and turns it into infographics.
Strengths:
- Beautiful data visualization — the most visually appealing option here.
- Real free tier — 5 reports/month, 1 watchlist, 1 portfolio of 10 stocks.
- Strong international coverage.
- Premium at $10.95/month — 30 reports/month, 3 portfolios. Unlimited at around $21.50/month — unlimited reports, 5 portfolios.
Weaknesses:
- Oversimplification can mislead. A single “fair value” with limited transparency about assumptions creates false confidence.
- Side-by-side metric comparison is limited.
- Scoring systems can be misleading (high growth score while cash flow is collapsing, for example).
Best for: Beginners who want a visual overview.
Morningstar — Premium Analyst Research
Morningstar is the gold standard for independent investment research, analyst reports and fund analysis.
Strengths:
- Economic Moat ratings and analyst reports are genuinely unique on this list.
- Fair Value estimates with transparent DCF models.
- Best-in-class fund and ETF analysis.
Weaknesses:
- Morningstar Investor is $34.95/month, with a 7-day free trial.
- Free tier is severely limited.
- Built around following analyst opinions more than hands-on DIY analysis.
Best for: Investors who actually read analyst reports and want fund coverage.
Macrotrends — Deep Free Data, Rough UX
Macrotrends offers free access to long-history financials.
Strengths:
- 10–20 years of historical income statements, balance sheets and cash flow data for most U.S.-listed companies.
- YoY growth and 5/10-year CAGRs computed automatically.
- Free, no login required.
Weaknesses:
- Slow site, dated design, ad-heavy.
- No screener, no portfolio tools, no peer comparison.
- Cross-check important figures against primary 10-K filings — see our 10-K reading guide.
- Mostly U.S. coverage.
Best for: Investors who need free long-history U.S. data.
Tired of analyzing stocks between pop-up ads? Join STOK Terminal free — STOK Terminal is built to keep fundamentals close to your watchlists and portfolio, without selling ad impressions.
Best Free vs Paid Investing.com Alternatives
If you want a free Investing.com alternative, the closest choices are Yahoo Finance for quotes and news, TradingView Basic for charts, Finviz for screening and Macrotrends for long U.S. financial history. The tradeoff is that each tool solves only one part of the workflow.
If you want a paid alternative for fundamental analysis, compare InvestingPro Pro+ against Koyfin, TIKR, Morningstar and STOK Terminal. That is where the decision shifts from “which site has quotes?” to “which tool helps me understand a business over several years?” The comparison table at the top summarizes pricing and features for both groups.
Other Sites Similar to Investing.com (News and Quotes)
If what you want is not an analysis tool but simply another site for quotes and market news, the most direct substitutes are Yahoo Finance, MarketWatch and CNBC (the latter two also fairly ad-heavy). They cover the editorial and quotes side, but none of them adds fundamental depth: you are switching portals, not categories. To move from reading about companies to analyzing them, you need one of the tools from the comparison above.
What Investing.com Gets Right That Others Don’t
To be fair: if you need a free global economic calendar, multi-asset real-time quotes and broad coverage, Investing.com is hard to beat. It is a Swiss Army knife for market data.
But a Swiss Army knife is not a scalpel. If what you actually need is to analyze the fundamental health of a company over time — read its financials, track its profitability over a decade, understand its debt trajectory — Investing.com’s free experience was not built for that, and the ads on the free site make the experience actively frustrating. InvestingPro Pro+ fixes most of those problems, but at $34.99/month it deserves to be compared against the alternatives above.
What STOK Terminal Is Building (and Honest Caveats)
STOK Terminal is currently in early access, opened from a free list in signup order. Joining the list is free and creates no charge; we say so upfront. Early users pay €6.95/month once they activate their access — a 50% discount off the €13.90 public price — and keep that 50% discount on the future public price while their subscription remains active. If they cancel and return later, the then-current price will apply. Nothing is charged while you wait on the list, and the trial only starts when you accept your invitation.
What is in early access today:
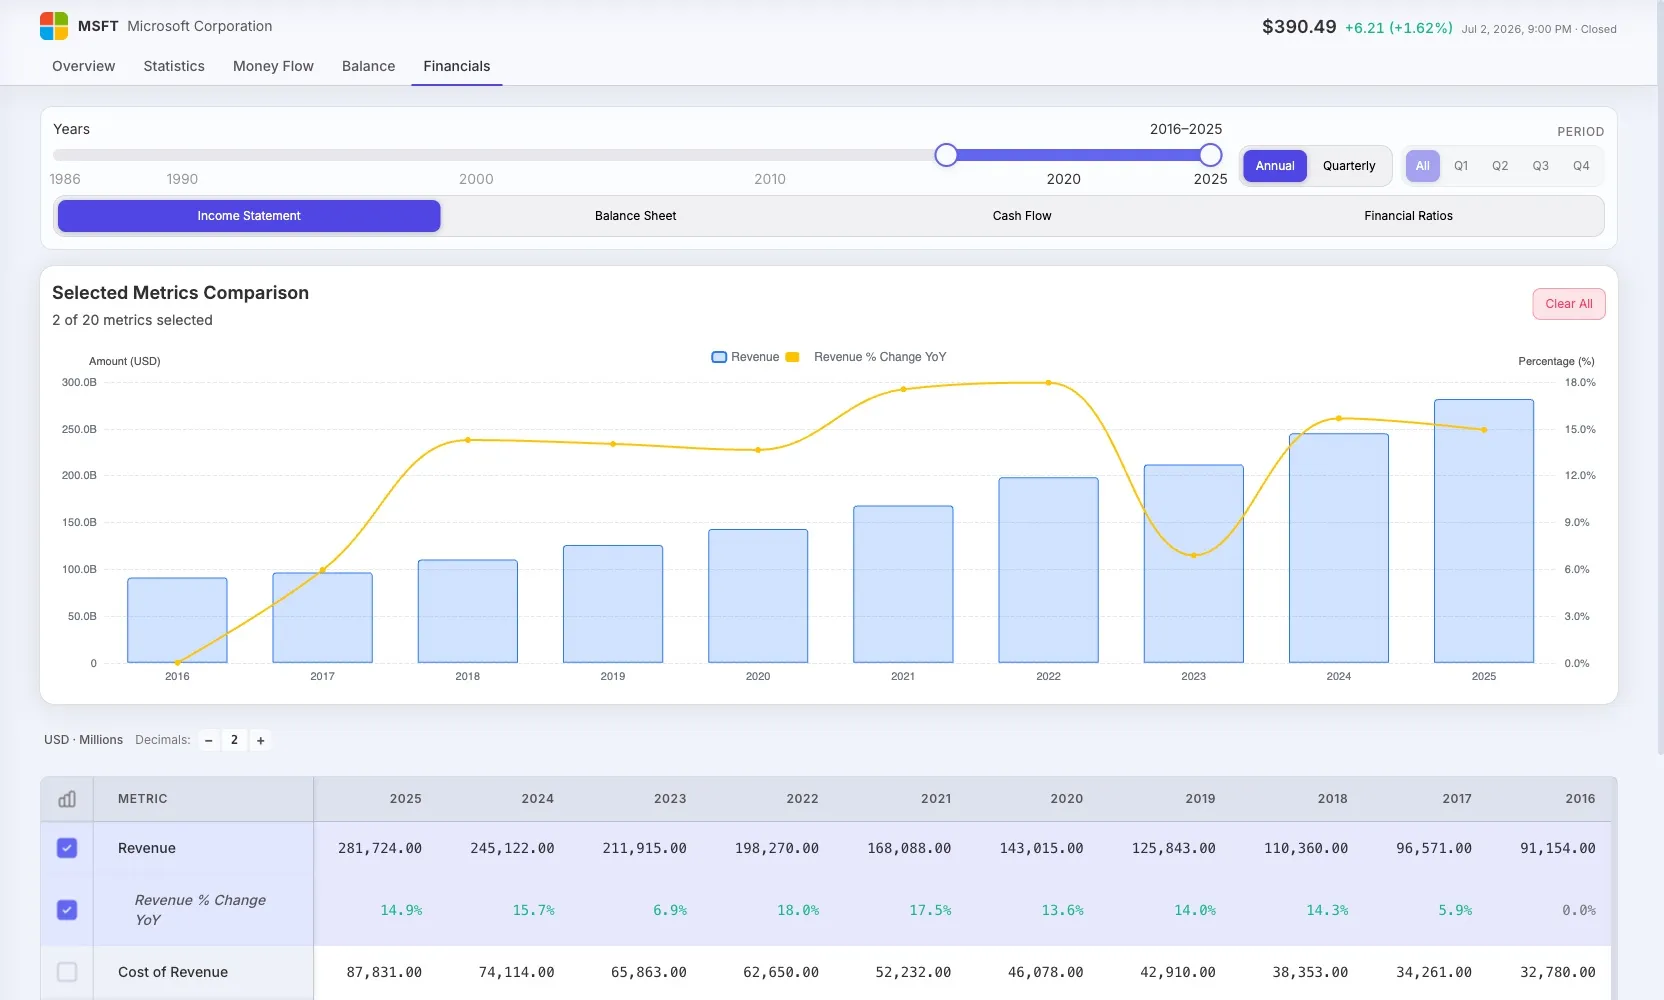
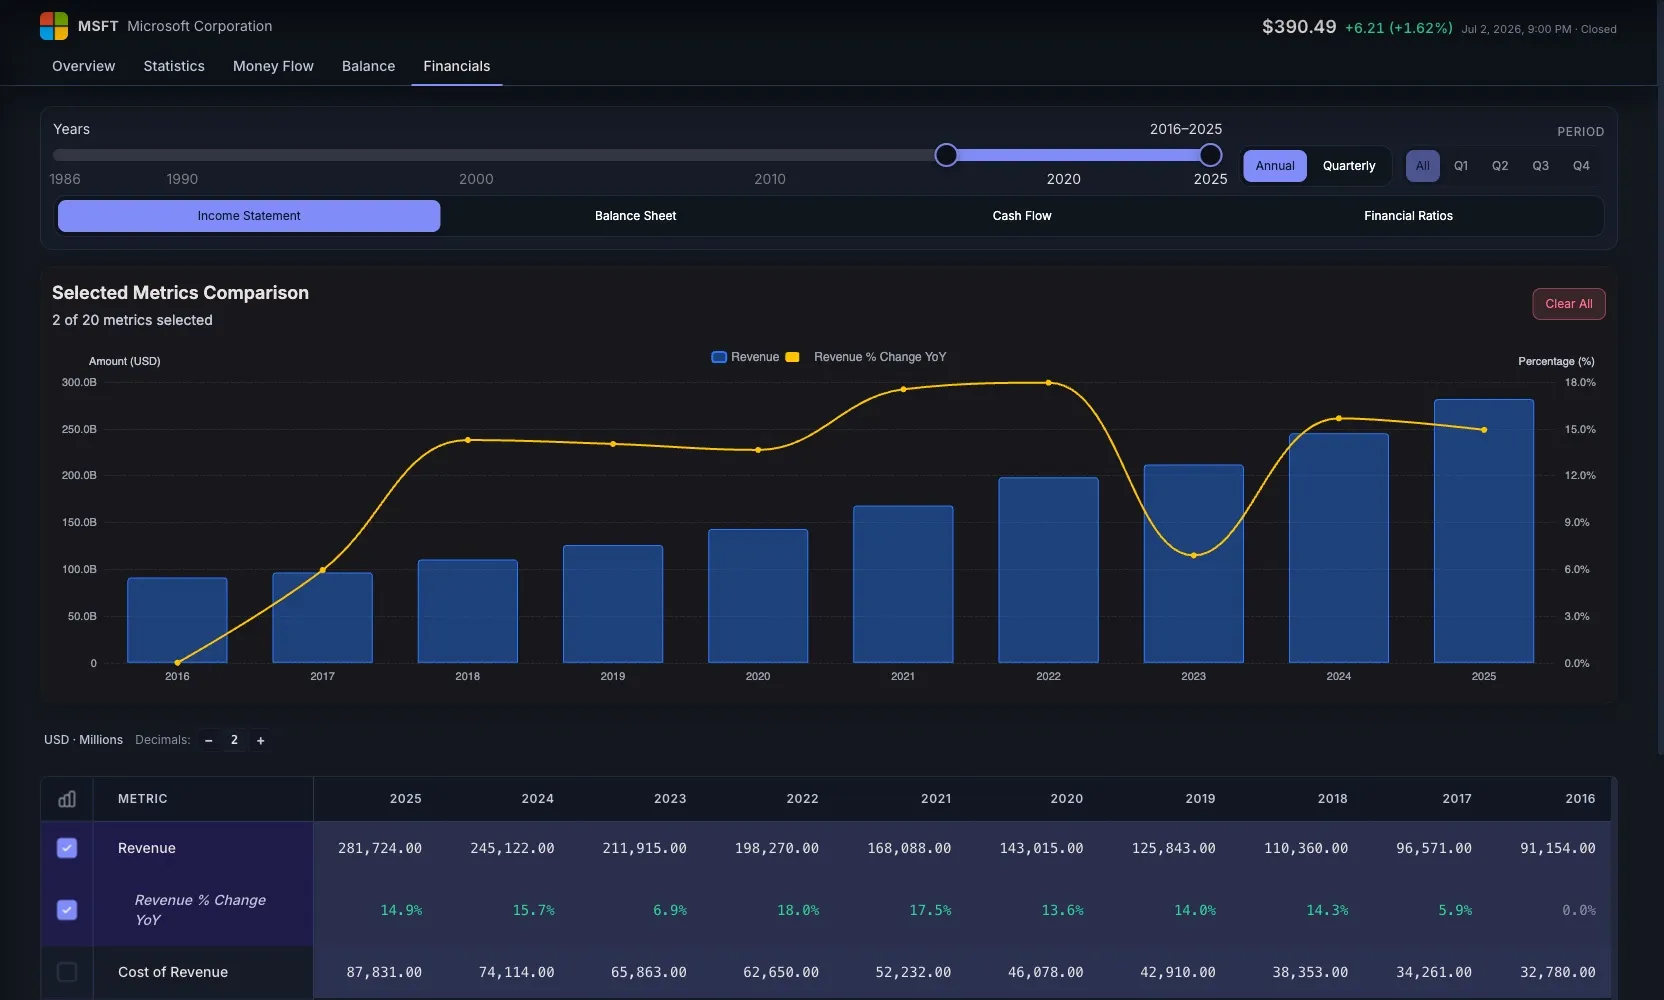
- Company Fundamentals — income statement, balance sheet, cash flow and ratios per company — annual and quarterly, with up to 30+ years of history, depending on company and plan — in multi-year side-by-side tables.
- Documents & notes — open filings like the 10-K or annual reports and keep per-company notes, with history and links, without leaving the company page.
- Money Flow — the company’s money flow, visualized: from revenue segments through costs down to net income, so you can see at a glance exactly how revenue turns into profit.
- Company Overview — price chart, profile, analyst consensus where available and key statistics linked to fundamentals.
- Watchlists with quotes, news, price history and direct ticker-level company access. We wrote a framework for using watchlists well.
- Portfolio tracking — real positions or simulated portfolios with holdings, cash and a full transaction ledger, plus a performance dashboard that breaks down cost, value and allocation per position.
- Market Overview — indices, movers, sectors and market news, built as context for company research rather than a feed.
What we explicitly do not offer: Investing.com’s economic calendar, real-time forex coverage, or Morningstar-style analyst reports. We are building a tighter workflow for the investor who wants to form their own fundamental thesis.
How We Compared
So you can judge the method, not just the conclusions, here is how this comparison was built:
- Official-source pricing, dated. Every price was taken from the vendor’s own site and we note when (between May and July 2026; TradingView on July 4 and the monthly plans of Koyfin, TIKR and Simply Wall St re-verified on July 11, 2026). We quote each plan’s monthly billing rate — most vendors discount if you pay a year upfront. Promotional and regional prices change — which is why we date them instead of quoting an “eternal” number.
- Fundamental-analysis focus, not trading. We judge each tool by what matters for reading a business over time: history depth, pre-calculated ratios (ROIC, FCF), comparable tables and research workflow — not by its charts.
- Hands-on use, not marketing sheets. Assessments come from using the tools and checking their plan limits on their own site, not from copying their feature pages.
- Conflict of interest disclosed. We are one of the tools on the list. That’s why we clearly mark what the others do better and which investor we are the wrong choice for.
If you want the detailed head-to-head with each rival, we have dedicated comparisons: STOK Terminal vs Investing.com, vs TradingView and vs Yahoo Finance.
How to Choose
A rough decision tree if you are looking for an Investing.com alternative:
- You mostly use the economic calendar. → Stay on Investing.com — it is genuinely the best.
- You are in it for the charts and trading. → TradingView (the free Basic plan already beats what you were doing on Investing.com).
- You upgrade to InvestingPro Pro+ for the depth. → Compare with Koyfin Plus, TIKR and Yahoo Finance Gold before deciding.
- You want raw fundamental data. → TIKR (from $24.95/mo).
- You want pretty visuals and an automatic verdict. → Simply Wall St.
- You want Bloomberg-style depth. → Koyfin Plus.
- You want analyst reports and Moat ratings. → Morningstar Investor.
- You just need free long-history U.S. data. → Macrotrends.
- You want fundamentals connected to watchlists and a real transaction ledger. → STOK Terminal (early access via waitlist).
Frequently Asked Questions
What is the best free alternative to Investing.com? For free fundamentals, Macrotrends (10–20 years of U.S. financials) and Finviz (a fast free screener) are the strongest options, and Yahoo Finance is a less ad-heavy generalist. None of them match Investing.com’s free economic calendar, which remains best-in-class.
Is InvestingPro worth it? InvestingPro Pro+ ($34.99/month) adds 10-year history, 1200+ metrics, a stock screener and an ad-free experience, which fixes the main problems of the free site. At that price it is worth comparing against Koyfin Plus and Yahoo Finance Gold before committing.
What is the best Investing.com alternative for fundamental analysis? For multi-year fundamentals in a clean, ad-free workflow tied to your watchlists and portfolio, STOK Terminal is purpose-built (early access, €6.95/month once access is activated). For Bloomberg-style breadth across asset classes, Koyfin is the closest affordable option.
Does Investing.com have a good free tier? Yes for the economic calendar, real-time quotes and broad multi-asset coverage. No for deep fundamental analysis: free financial history is shallow, key ratios like ROIC are not pre-calculated, and the ads make focused analysis frustrating.
What platforms are similar to Investing.com? The closest matches for coverage, quotes and news are Yahoo Finance, TradingView and MarketWatch. If you want more fundamental depth, the specialized alternatives are Koyfin, TIKR and STOK Terminal; for fast screening, Finviz.
Is TradingView a good alternative to Investing.com? For charts and technical analysis, yes — it is the reference platform (Essential from €12.95/month; there is a free plan). For fundamental analysis, no: its paid tiers scale charts, indicators and alerts, not financial statement depth. We cover this in our guide on TradingView and fundamental analysis.
What is the best Investing.com alternative for portfolio tracking? If you just want to log positions and watch their value, Yahoo Finance’s free tracker is fine. If you want your portfolio connected to each holding’s fundamentals, with a full transaction ledger and a dashboard that breaks down cost, value and allocation, STOK Terminal is built exactly for that.
Analyze Stocks Without Dodging Ads
STOK Terminal brings portfolio tracking, watchlists, market view and company fundamentals into one focused workflow — in a clean interface designed for focus, not for selling ad impressions.
Join STOK Terminal free — fundamental analysis, without the noise.
Competitor pricing and features were verified against official sources between May and July 2026 (TradingView on July 4, EU version in euros; the monthly plans of Koyfin, TIKR and Simply Wall St on July 11). Monthly billing rates are quoted; most vendors discount annual payment. Promotional and regional pricing may vary. Confirm current numbers on each vendor’s site before subscribing.