
Data methodology and coverage
Last updated: November 5, 2026
Financial figures need context. This page explains how to read the data and its limits before using it in your research.
Sources and origins
Company statements and regulatory filings provide reported financial figures. Structured financial feeds and market data are used to organize the information in the app.
Origin labels distinguish reported figures, market data, calculations by Stok Terminal and, where applicable, scores received from a data source. An origin label does not mean that every value has a direct link to its original filing. Consult the available company documents when you need to verify a figure.
Reported figures and calculations
Reported figures and derived metrics serve different purposes. Metric information explains the definition, formula and origin where those details are available. Ratios can differ from another service when definitions or inputs differ.
For example, Stok Terminal defines free cash flow as operating cash flow minus the magnitude of purchases of property, plant and equipment. It is a calculated measure, not a reported accounting profit or a measure of maintenance investment. Check the formula before comparing it with an issuer’s own adjusted measure.
Annual, interim and trailing periods
Check the fiscal year and closing date. An annual period does not necessarily end in December. Interim reporting may cover a quarter, half-year or another duration, depending on the company.
TTM and LTM refer to twelve months of activity. Income and cash-flow figures require a valid period window; the app may use a supplied trailing figure or derive it from covered periods. A balance sheet describes a position at a closing date and is not added across twelve months.
The comparison table identifies each company’s LTM closing date. Companies can have different reporting dates: a value shown side by side is not proof that both refer to the same calendar window.
Currency, units and rounding
Read the currency code and scale beside the table. A value in USD millions is not the same as one in USD billions or EUR millions. Per-share values and percentages use their own units. Display rounding can produce small differences from a calculation using the underlying amounts.
The currency in which a company reports can differ from its share-price currency. Some listings also quote prices in minor units. When a conversion needed for a calculation is unavailable, the result can remain unavailable instead of combining incompatible currencies.
Coverage and plan limits
Available companies, line items, documents and reporting periods vary. The history displayed also depends on the subscription plan. Premium includes all available financial history; it does not guarantee the same number of years for every company. Consult the pricing page for current plan limits.
Company comparison is limited by the selected plan. Financial statements and the visual business-flow, capital-allocation and balance-composition views have different plan availability. A demonstration of one view does not imply that every plan includes it.
An unavailable value does not mean zero. A metric can be absent because inputs are missing, a period is incomplete or the metric does not apply to that type of company. Consult the reason displayed before drawing a conclusion.
Updates, delays and revisions
Quotes are delayed; use the timestamp and delay notice available in the app. Financial statements follow the company’s reporting cycle and depend on source availability, processing and caching. An update to one dataset does not mean that every dataset has refreshed.
The date a period ends, the date figures become public and the time you consult them are different dates. Coverage and historical figures can change after corrections or restatements. We do not promise immediate incorporation of every filing or error-free data.
Checking and reporting a discrepancy
First check the company or listing, metric definition, fiscal period, currency, scale and the source document. Different share classes, closing dates or definitions can explain an apparent discrepancy.
If the difference remains, contact support with the company, metric, period, value shown and a link to the relevant public document. Do not send passwords, payment-card details or private account data. The team reviews the report and, when a correction is confirmed, updates the affected material.
Example: compare operating margins
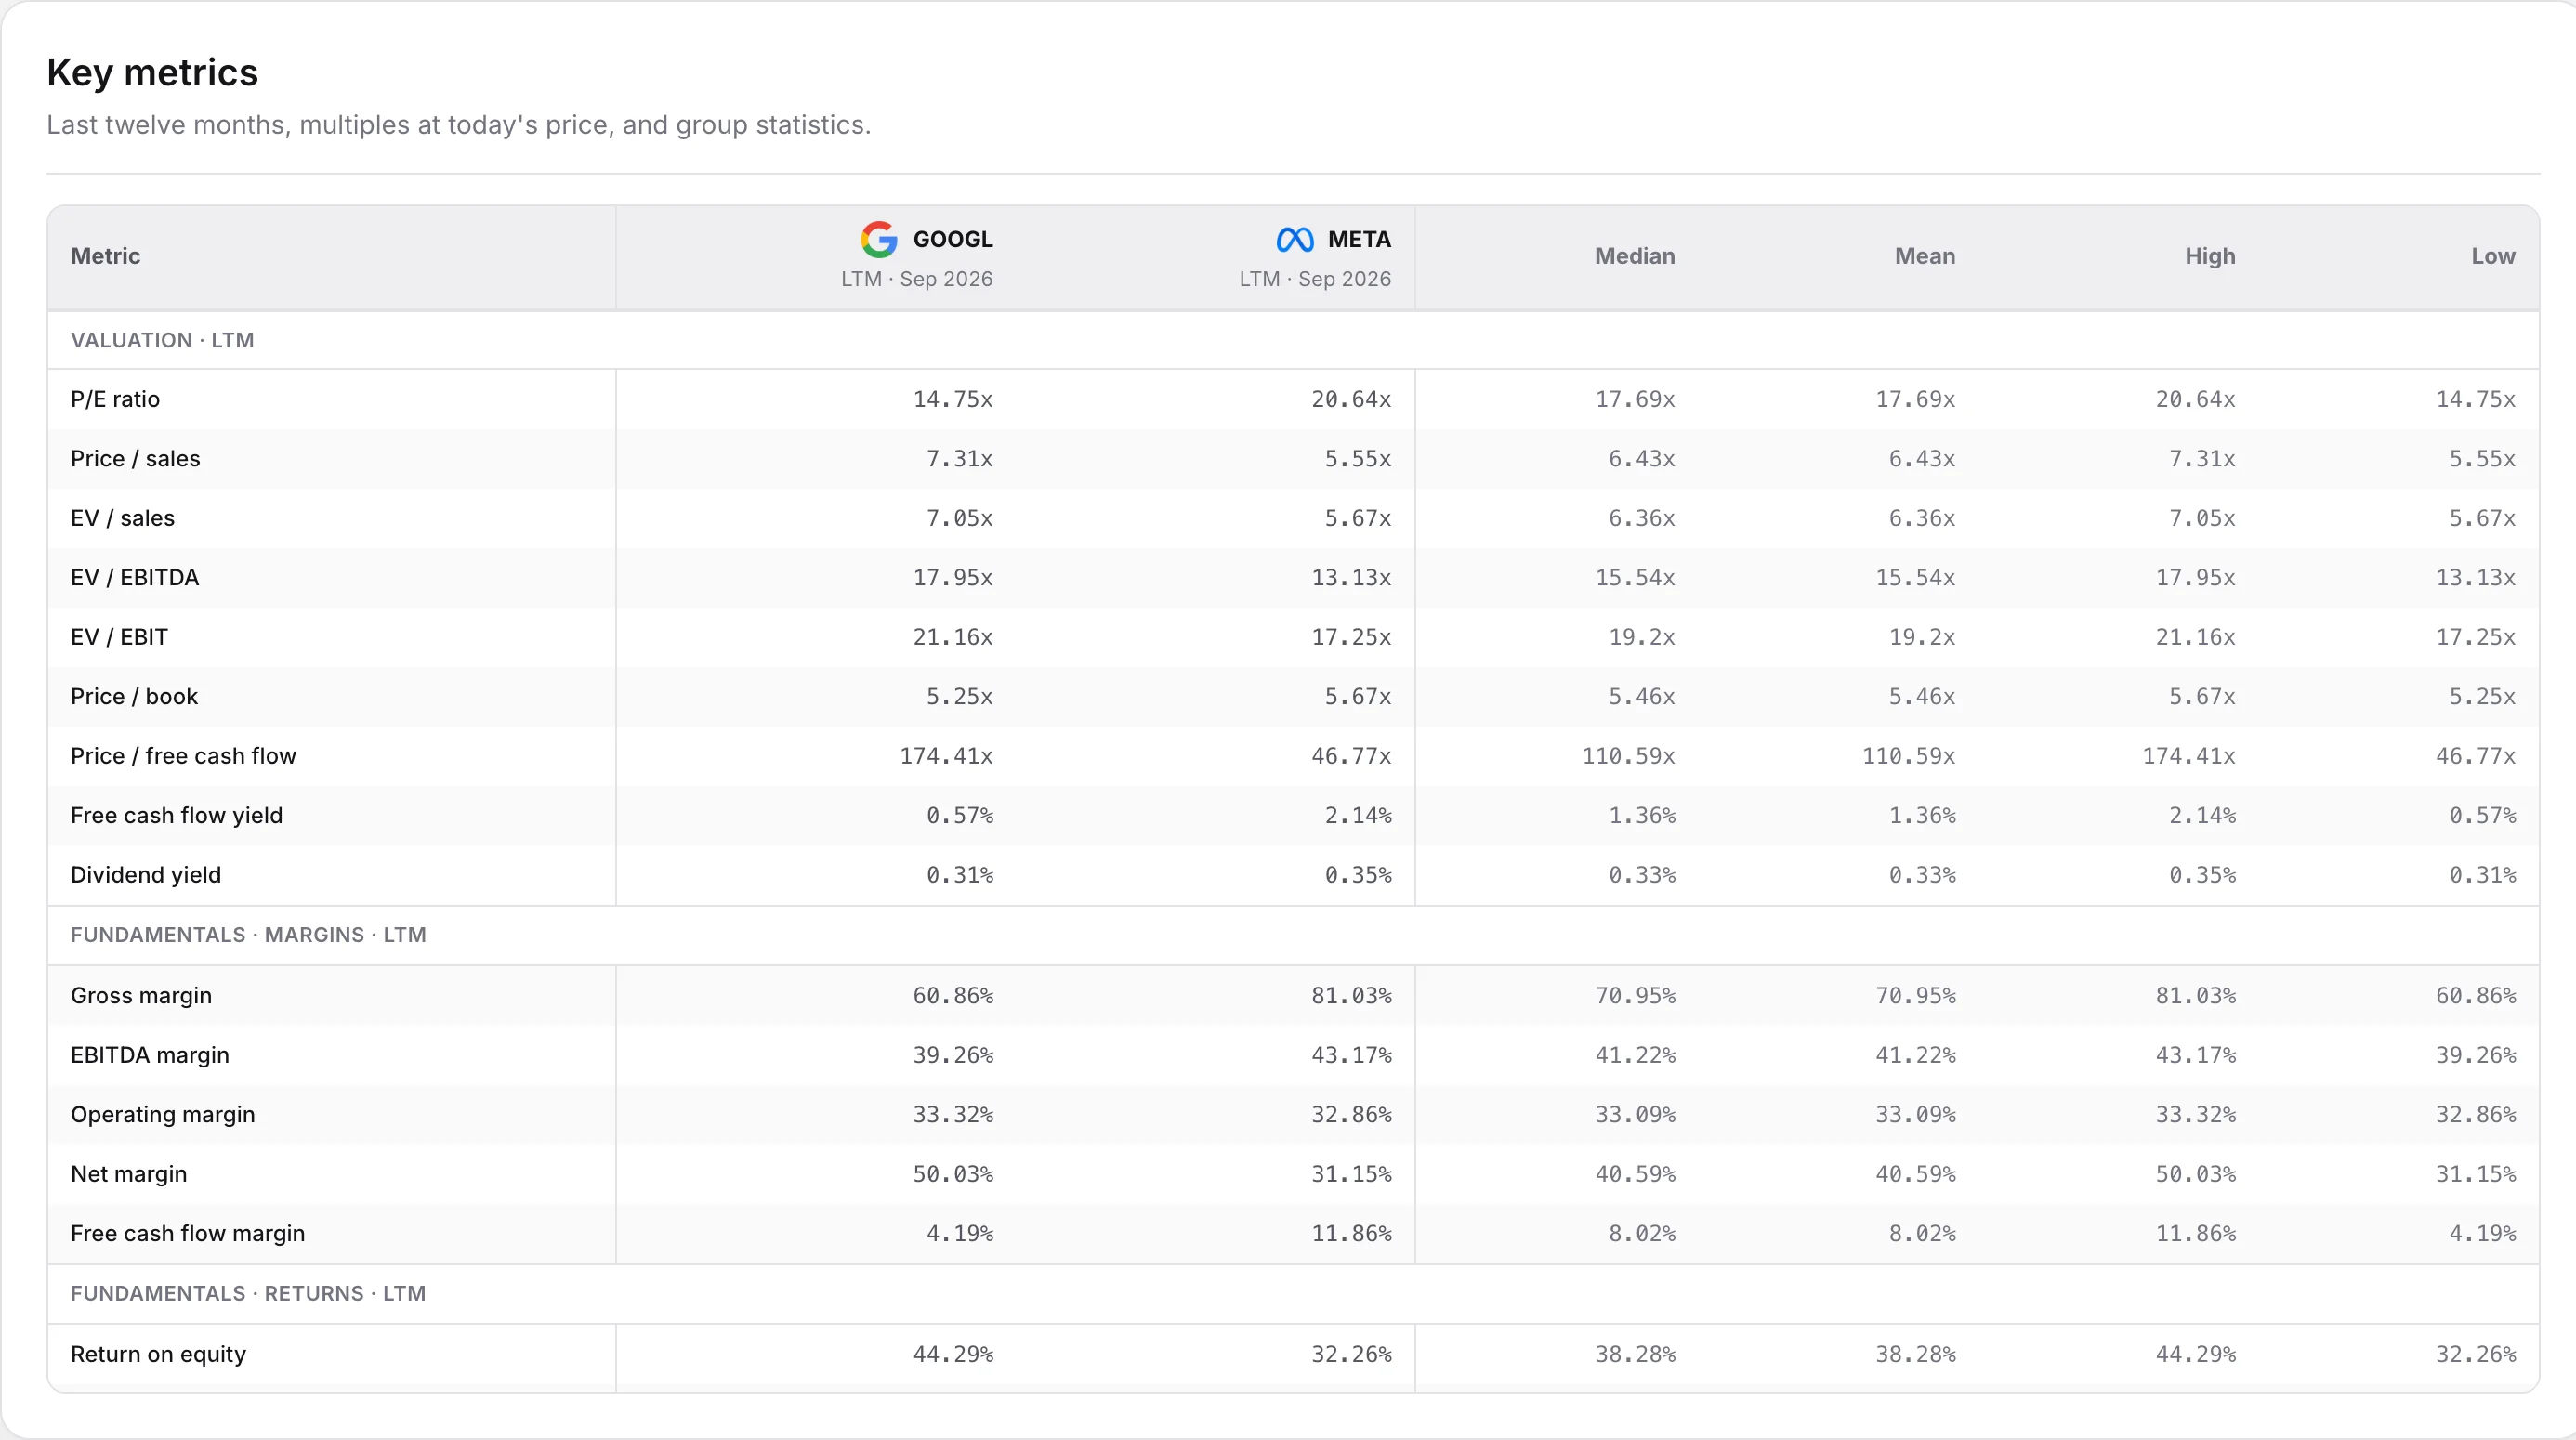
Real Stok Terminal v0.28.1 interface, captured on November 6, 2026. Alphabet and Meta are shown as a product example, separate from the hypothetical A/B calculation below.
Both companies show LTM periods ending in September 2026. Digital advertising is a shared revenue source; their products, business mix and reporting dates can differ.
This 2-company comparison is available in Starter, Plus, and Premium within the current plan limits. Individual metrics depend on data coverage.
The figures reflect the product at the capture date. Quotes and trailing periods can change; the image does not establish that the businesses are interchangeable.
Hypothetical example prepared for this explanation. Company A and Company B are invented; these values are not company records or a live Stok Terminal comparison.
Illustrative twelve-month window ending June 30, 2026. Amounts in USD millions; margins are calculated percentages.
| Company | Revenue | Operating income | Operating margin |
|---|---|---|---|
| Company A | 1,000 | 200 | 20% |
| Company B | 2,000 | 300 | 15% |
Operating margin = operating income ÷ revenue. A: 200 ÷ 1,000 = 20%. B: 300 ÷ 2,000 = 15%.
Company B has more operating profit in absolute terms, while Company A has the higher margin. That difference alone does not establish which is the better investment.
- In the app, select companies within your plan limit and read the LTM closing date shown for each one.
- Review operating margin alongside the inputs and the statistics for the selected group. Check missing values and differences in reporting dates.
- Use the company’s statements and metric definition to investigate the difference before drawing a conclusion. The hypothetical companies here are an arithmetic illustration, not selectable listings.
Company comparison is available within the plan limits: Starter 2, Plus 4 and Premium 6 companies. Availability of individual metrics depends on coverage.
Limits: the example assumes the same currency, period and definition. Real company comparisons can differ in closing dates, accounting policies and business models. A margin is not a buy or sell signal.
Example reviewed: November 5, 2026
Example: read cash flow and calculate free cash flow
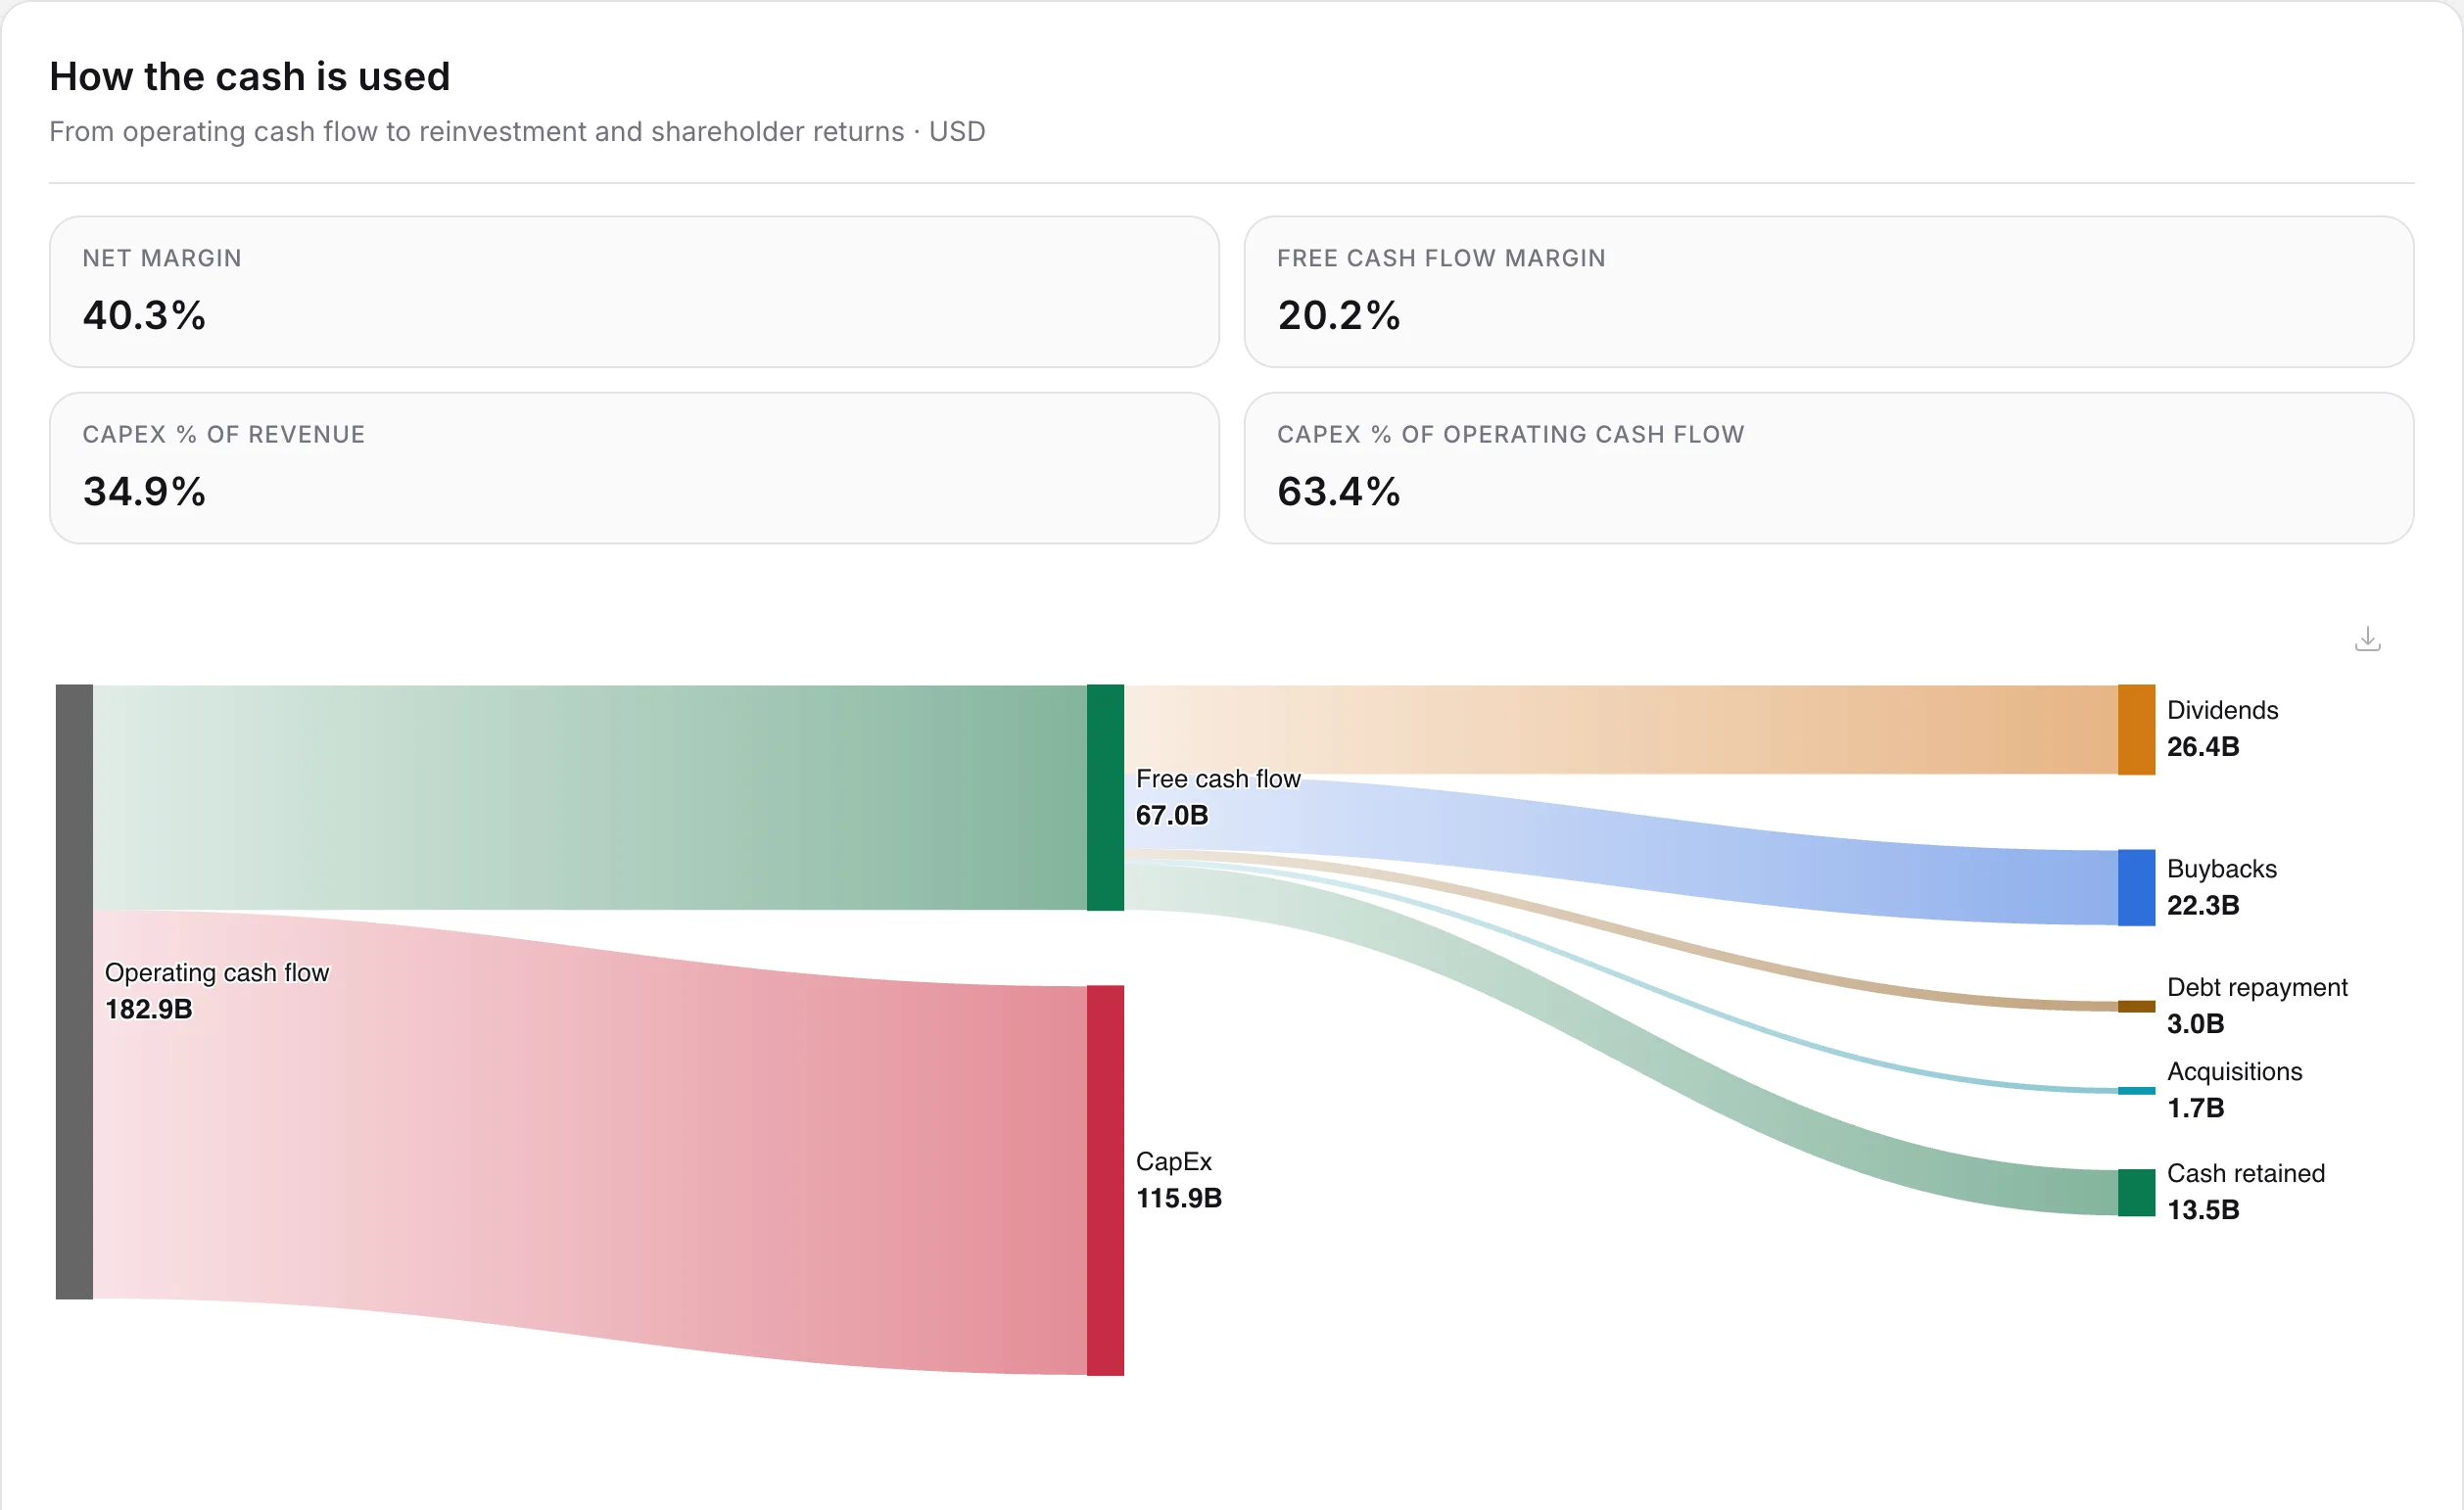
Real Stok Terminal v0.30.1 interface, captured on November 8, 2026, with Microsoft fiscal year 2026 selected. The interface language is English.
Year ended 30 June 2026. The image rounds amounts in USD billions: 182.9B of operating cash flow, 115.9B of CapEx and 67.0B of free cash flow. The reproducible calculation below uses USD millions; it does not subtract the rounded display amounts.
The visual capital-allocation view shown here is included in Plus and Premium, according to the current plan configuration. Basic financial statements have their own history and coverage limits and do not require this visual view.
This dated capture shows the selected annual period; other views can show LTM figures. It illustrates the calculation and cash allocation, not an independent audit or a promise that every company has the same coverage.
Microsoft, fiscal year 2026, ended June 30, 2026. Reported amounts in USD millions, checked on November 5, 2026. This is a dated example from the issuer’s report, not a live quote or a claim that the current app snapshot uses this annual period.
| Item | USD millions | Origin |
|---|---|---|
| Net cash from operations | 182,935 | Reported by the company |
| Purchases of property, plant and equipment | -115,948 | Reported by the company |
| Free cash flow under the definition used here | 66,987 | Calculated for this example |
182,935 − |-115,948| = 66,987 million USD. The outflow is subtracted once, using its magnitude.
After this definition of material investment, 66,987 million USD remains from operating cash flow. It is not accounting profit or cash automatically available to shareholders.
- Open the company’s financial statements and identify the cash-flow view, fiscal year, currency and scale. For this example, use Microsoft’s year ended 30 June 2026.
- Find net cash from operations and additions to property and equipment in the issuer’s cash-flow statement. Keep the outflow sign separate from the formula.
- Subtract the magnitude of the investment from operating cash flow and compare the result with the metric definition. The published source below allows you to reproduce the arithmetic without an account.
Reading basic financial statements is available on all plans within each plan’s history limit and the company’s coverage. Separate visual capital-allocation views require an eligible plan.
Limits: this measure does not deduct acquisitions, new finance-lease obligations or every use of cash. It is not an estimate of maintenance investment and can differ from another definition of free cash flow.
Stok Terminal provides information for independent research. Investment decisions and conclusions remain yours.