
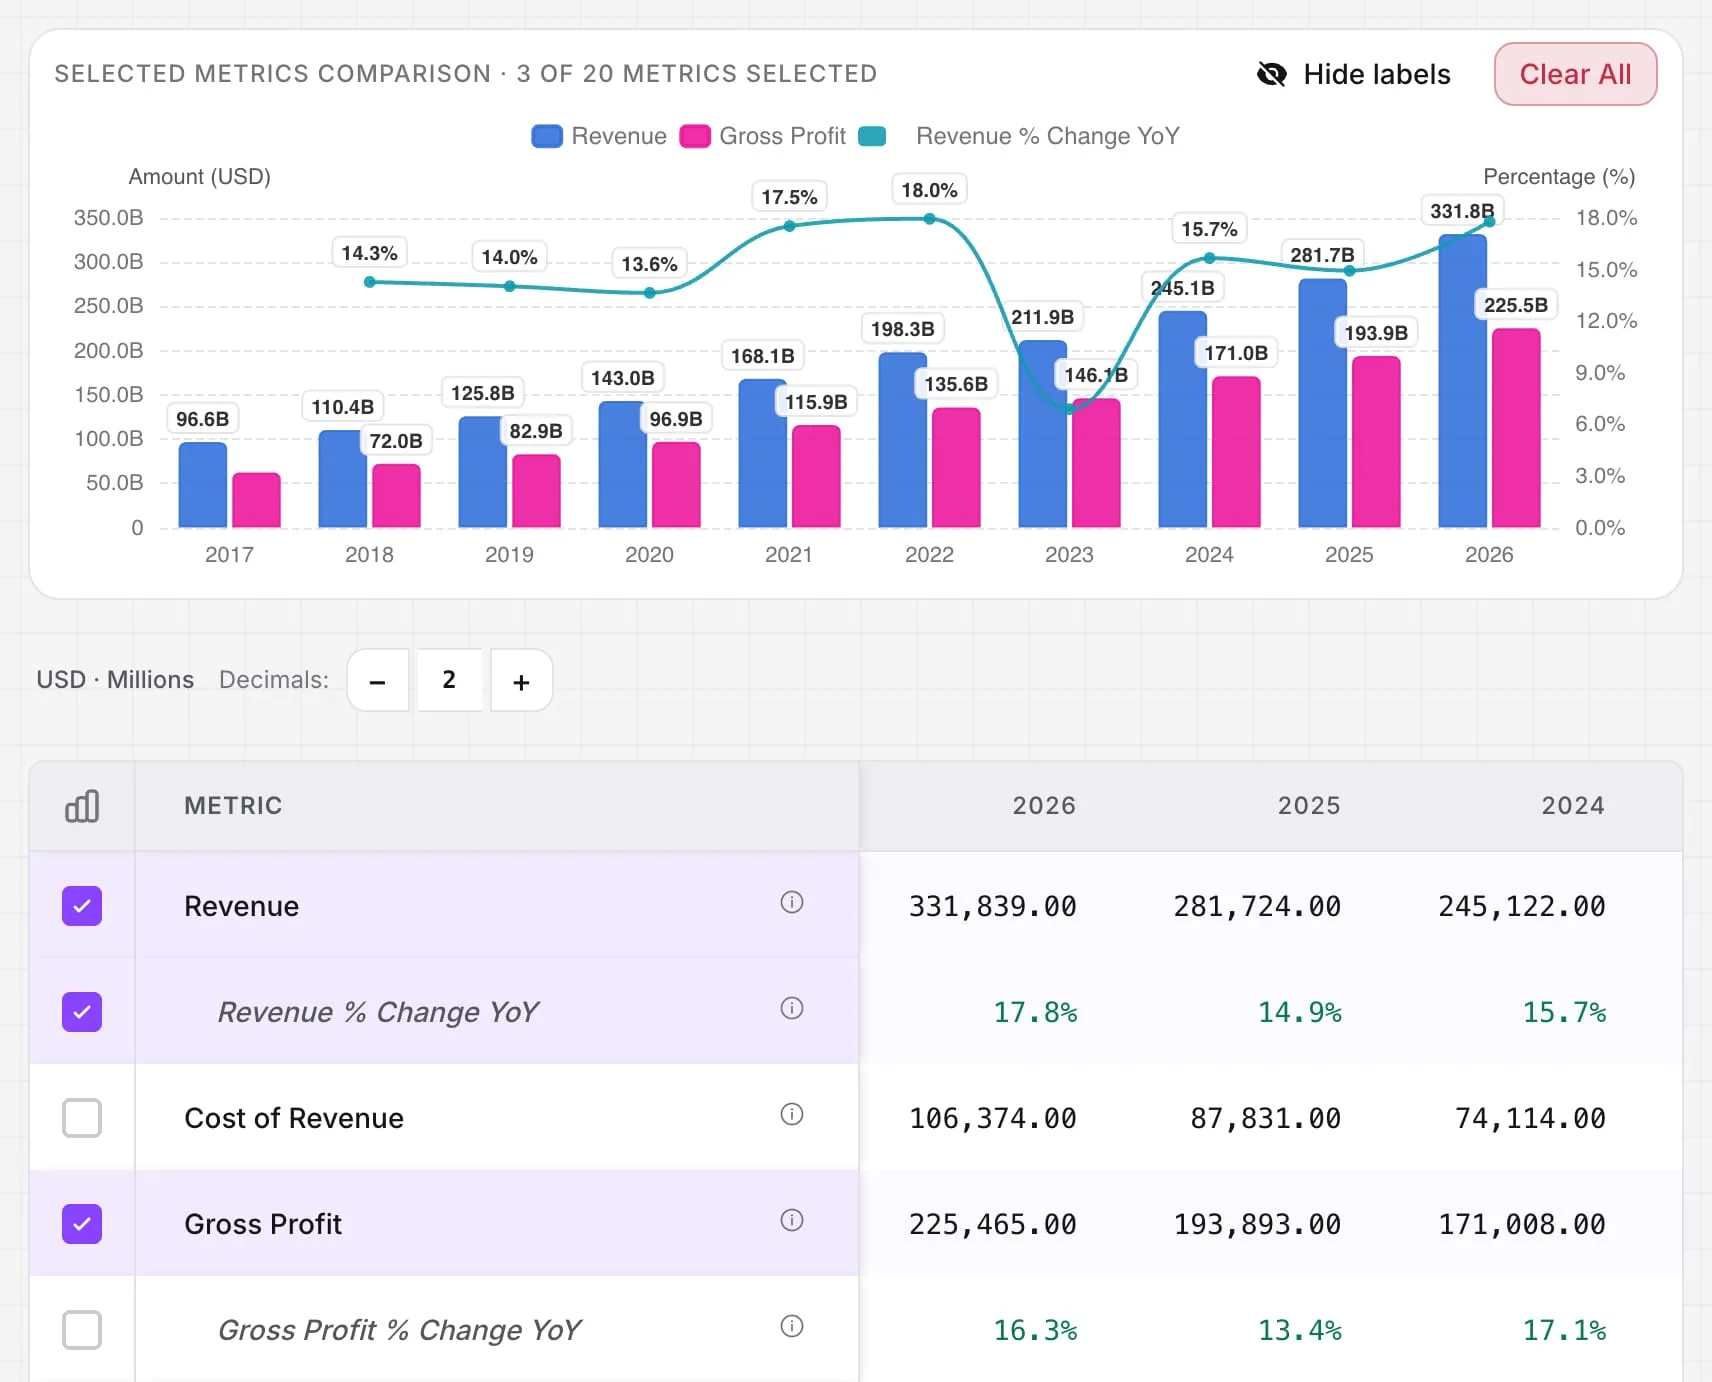
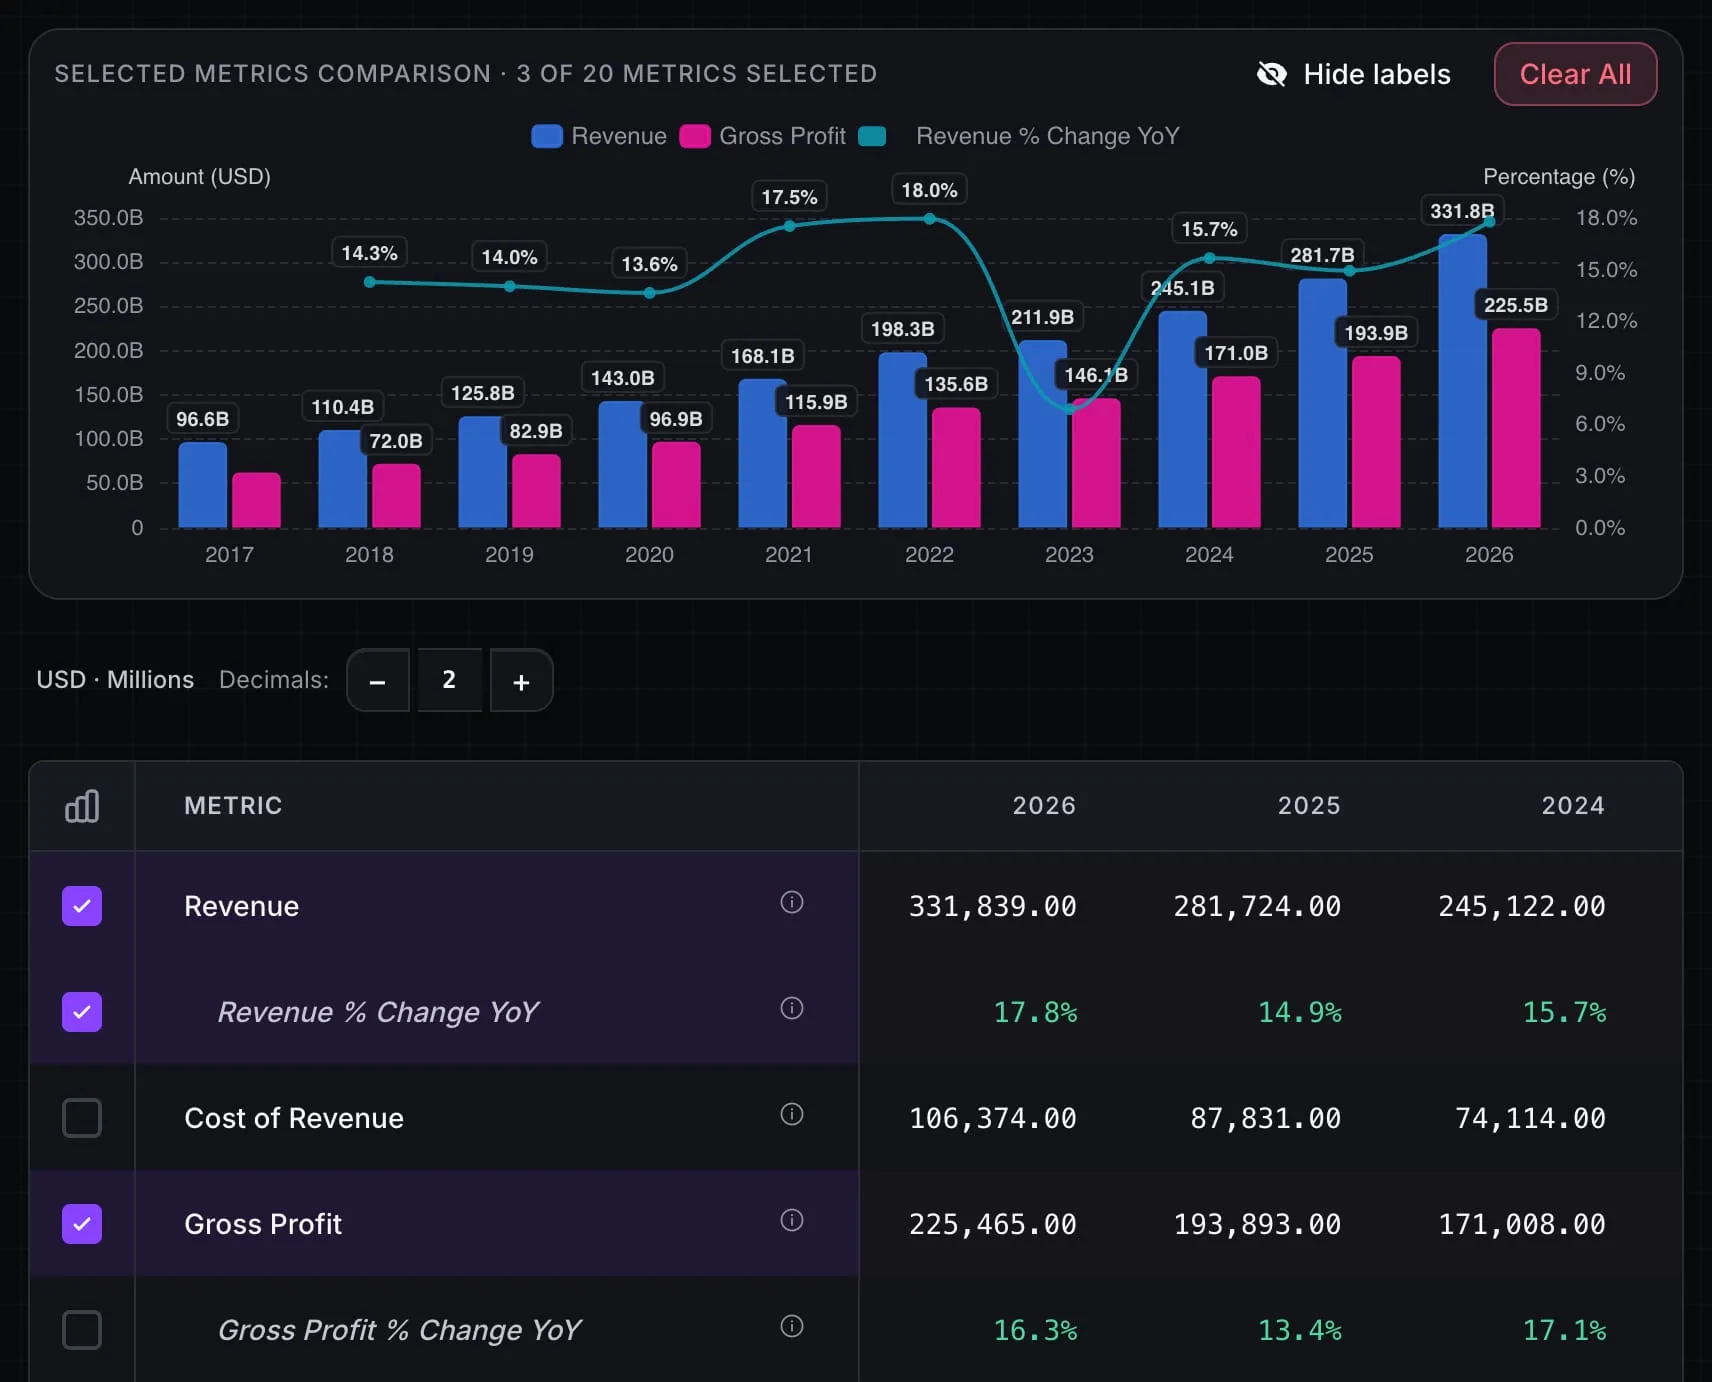
A company’s financial statements are three documents that tell the same story from different angles: what it earned, what it owns and owes, and the cash that actually came in and went out. Each one on its own leaves questions open. Read together, they show whether the profit is real, whether it turns into cash and whether the balance sheet can hold.
This guide explains how they connect and in which order to read them. To go into each one in detail, there is a simple guide to the income statement, the balance sheet and the cash flow statement.
Quick answer
Start with the income statement to see how sales and margins evolve; check profit against operating and free cash flow; review net debt and cash on the balance sheet; and finish with the annual report, which explains what the numbers leave out. Use at least five years: a trend says more than a single year.
The three statements and the question each one answers
| Statement | What it shows | Period | Question it answers |
|---|---|---|---|
| Income statement | Revenue, costs and profit | A quarter or a year | Does the business make money, and how much? |
| Balance sheet | Assets, debts and equity | A single date (year end) | What does it own, owe, and how much can it absorb? |
| Cash flow statement | Cash in and out from operations, investing and financing | A quarter or a year | Is the profit collected, and where does it go? |
Full accounts add the statement of changes in equity and the notes that explain each line. If a term slows you down, the financial statements glossary covers the 14 concepts that come up most.
How they connect: an example with Lumen Coffee
Lumen Coffee is the fictional company we use in the beginner guides. These are its figures for one year, in millions of euros:
| Income statement | Amount | Balance sheet at year end | Amount | Cash flow | Amount |
|---|---|---|---|---|---|
| Revenue | €100m | Cash | €20m | Operating cash flow | €19.5m |
| Gross profit | €60m | Receivables and inventory | €25m | Investing cash flow | −€8m |
| Operating profit | €25m | Fixed assets and goodwill | €55m | Financing cash flow | −€9m |
| Interest expense | −€3m | Financial debt | €30m | Change in cash | €2.5m |
| Taxes | −€5.5m | Payables | €15m | ||
| Net income | €16.5m | Shareholders’ equity | €55m |
Three bridges link the three tables:
- From profit to cash. Operating cash flow starts from €16.5m of net income, adds €5m of depreciation, which is not a cash outflow, and subtracts €2m tied up in receivables and inventory: €19.5m.
- From cash flow to the balance sheet. The €2.5m change in cash is exactly how much cash rises on the balance sheet, from €17.5m to €20m.
- From profit to equity. Equity grows by the profit the company keeps: €16.5m of net income minus €4m of dividends.
If one of those bridges does not add up in real accounts, the explanation is in the notes, and it is worth finding before going further.
In which order to read them: four steps
- Start with the income statement. Look at how revenue, gross margin and operating margin evolve over at least five years. Lumen turns every €100 of sales into €25 of operating profit: a 25% operating margin.
- Check profit against cash. Compare net income with operating cash flow and free cash flow, which is operating cash flow minus investment. Lumen generates €11.5m of free cash flow, 70% of its net income. If cash lags profit for years, you need to know why.
- Review the balance sheet. Look at net debt, cash and working capital. Lumen owes €30m and holds €20m in cash: net debt of €10m, small against its €30m of EBITDA.
- Go to the original report. The annual report explains the risks, the segments and the notes the numbers leave out. For a US-listed company that report is the 10-K: see how to read a 10-K in 30 minutes.
Five ratios that cross statements
Many of the most useful ratios take one figure from one statement and another from a different one. With Lumen’s accounts:
| Ratio | Calculation | Lumen | What it tells you |
|---|---|---|---|
| Operating margin | Operating profit ÷ revenue | 25% | How much the core business keeps from each euro sold |
| Free cash flow conversion | Free cash flow ÷ net income | 70% | How much of the profit ends up as available cash |
| ROE | Net income ÷ shareholders’ equity | 30% | What shareholders’ money returns |
| Net debt / EBITDA | (Debt − cash) ÷ (EBIT + depreciation) | 0.33x | How many years of EBITDA it would take to repay the debt |
| Interest coverage | Operating profit ÷ interest expense | 8.3x | How many times the business covers the cost of its debt |
To judge business quality without the effect of debt, the reference ratio is ROIC, which also combines the income statement and the balance sheet.
Warning signs that only appear when you cross them
- Profit grows and operating cash flow does not. It can be a matter of collection timing, but if it repeats for several years, accounting profit is running ahead of real money.
- Receivables grow faster than sales. The company may be offering longer payment terms to hold up revenue.
- Debt rises while dividends or buybacks grow. The payout is being funded with loans, not with the cash the business generates.
- Investment stays below depreciation for years. Free cash flow looks high because the company is not replacing its assets.
- Goodwill is large relative to equity. Acquisitions paid above book value can end in impairments that cut profit at once.
None of these signs is a verdict. They are questions the notes and the annual report should answer.
Where to find the financial statements of a listed company
- On the company’s website. The investor relations section publishes the annual and interim accounts and the results presentations.
- In the US, in the reports companies file with the SEC: the annual 10-K and the quarterly 10-Q.
- In Europe, in the annual and half-yearly financial reports that listed companies file in each country’s official database: the CNMV in Spain, for example, or the National Storage Mechanism in the UK.
- For unlisted companies, the route is the national companies register, such as Companies House in the UK. We walk through a Spanish case in how to read a Spanish company’s annual accounts.
If you compare several companies, the figures need to be in the same format and on the same basis for all of them: we cover that in how to compare companies.
Frequently asked questions
What are the financial statements of a company? The three main ones are the income statement, the balance sheet and the cash flow statement. Full accounts also include the statement of changes in equity and the notes that explain each line.
Which financial statement is the most important? None is enough on its own. The income statement says whether the business makes money, the cash flow statement whether that profit is collected, and the balance sheet whether the company can survive a bad year. The most useful signals appear when you compare them.
Where can I find the financial statements of a listed company? On the investor relations page of the company itself. In the US, in the 10-K (annual) and 10-Q (quarterly) reports filed with the SEC; in Europe, in the annual and half-yearly reports filed in each country’s official database, such as the CNMV in Spain or the National Storage Mechanism in the UK.
How often are financial statements published? US companies publish quarterly accounts in the 10-Q and annual accounts in the 10-K. In the EU and the UK, listed companies must publish an annual and a half-yearly financial report, and many also publish quarterly results.
This is an educational explanation, not accounting, tax or financial advice. Lumen Coffee is a fictional company; real accounts contain more lines and should be read with their notes.
The three statements of every company, in one place
Stok Terminal shows the income statement, balance sheet and cash flow statement of each listed company, annual and quarterly.
Join the Stok Terminal launch list free — access opens in signup order.